Dividend Data vs QuickData.ai
Side-by-side comparison to help you choose the right AI tool.
Dividend Data
Dividend Data instantly delivers stock dividends, prices, and financials directly into your Google Sheets or Excel spreadsheets.
Last updated: March 11, 2026

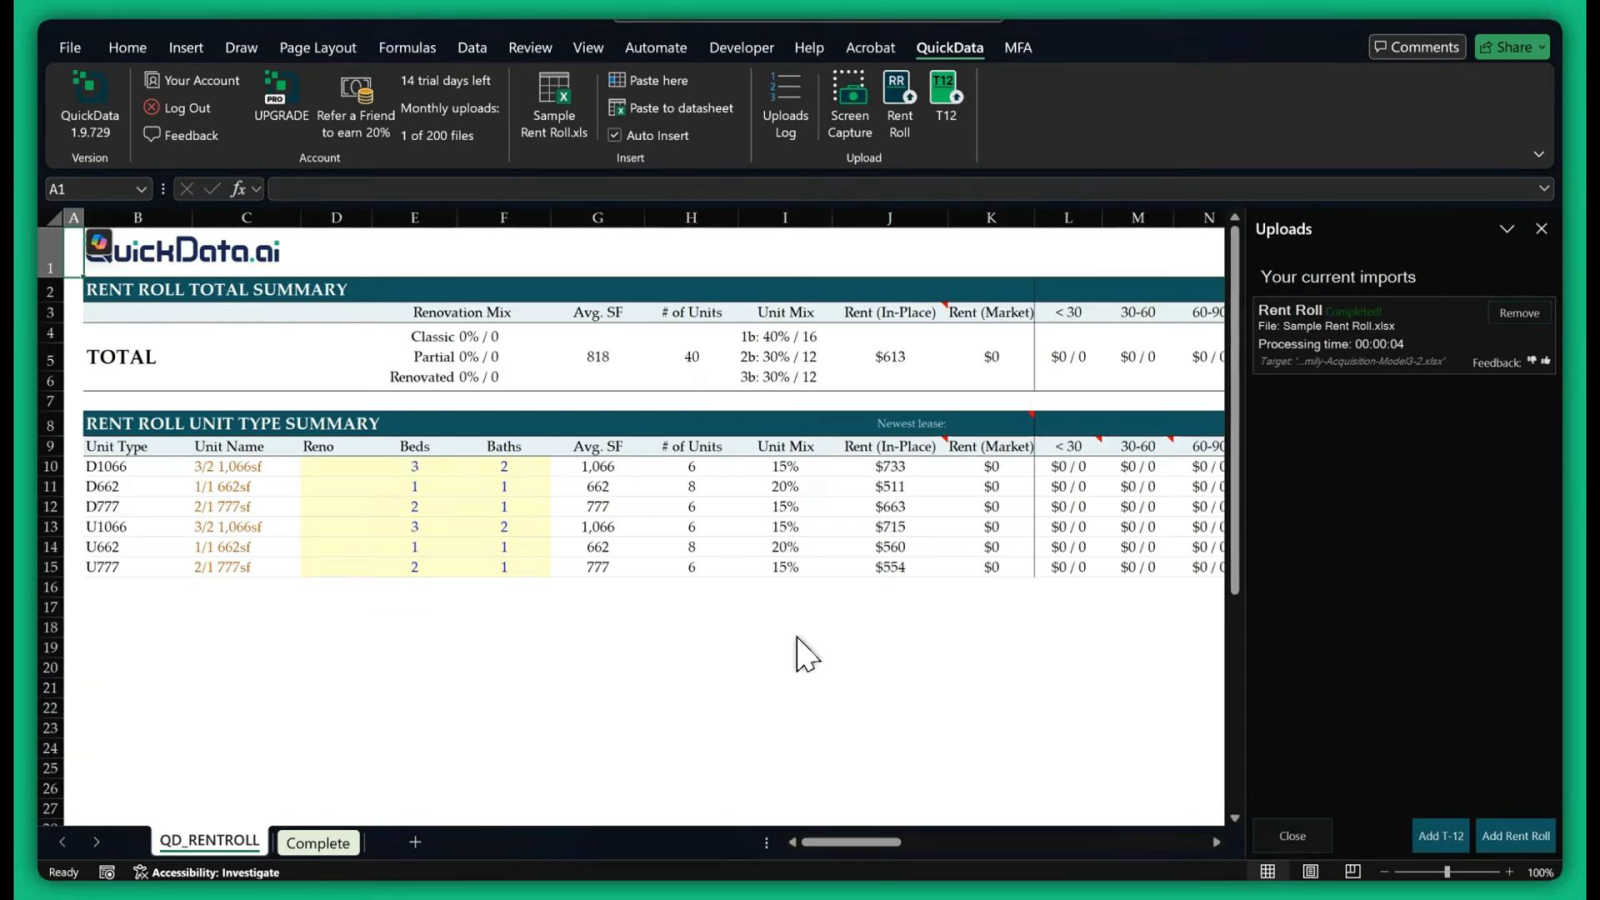
QuickData.ai
QuickData.ai automates rent roll and T12 data entry into Excel, saving underwriters 15 hours each month.
Last updated: March 1, 2026
Visual Comparison
Dividend Data

QuickData.ai
Feature Comparison
Dividend Data
Extensive Custom Spreadsheet Functions
Dividend Data provides a specialized library of 16+ custom functions, such as DIVIDENDDATA_DIVIDENDS and DIVIDENDDATA_RATIOS, that act as direct conduits to live financial data. Users simply type these formulas into any cell, referencing a stock ticker and desired metric, and the platform instantly populates the cell with accurate, updated information. This transforms static spreadsheets into dynamic, auto-updating financial dashboards, covering everything from forward dividend yields and ex-dates to P/E ratios and diluted EPS.
Deep Historical & Fundamental Data Library
The platform grants users access to a vast repository of over 30 years of historical market data. This is not limited to price history but extends deeply into fundamental analysis, including decades of dividend payments, annual and quarterly financial statements, and hundreds of key financial ratios. This long-term perspective is crucial for conducting thorough trend analysis, assessing a company's financial resilience through cycles, and building robust valuation models based on historical performance.
Multi-Platform Spreadsheet Integration
A key operational feature is its seamless compatibility with both Google Sheets and Microsoft Excel. Users are not locked into a single ecosystem; they can leverage Dividend Data's capabilities within their preferred spreadsheet environment. The add-ins are officially available on the Google Workspace Marketplace and Microsoft AppSource, ensuring easy installation, secure operation, and smooth performance whether working in the cloud with Sheets or locally with Excel.
AI-Powered Research & Portfolio Tools
Beyond spreadsheets, Dividend Data offers a web-based Terminal featuring advanced tools like an AI Analyst. This assistant can answer complex investment questions, generate research reports, and provide insights based on the platform's extensive dataset. Coupled with automated portfolio tracking that aggregates holdings, calculates projected income, and visualizes performance, it creates a holistic research and management suite for the modern investor.
QuickData.ai
Multifamily Excel Model
The Multifamily Excel Model feature allows users to integrate QuickData.ai directly into their existing Excel spreadsheets. This seamless integration ensures that extracted data is automatically populated into the appropriate fields, enhancing workflow efficiency and accuracy.
Automated Data Extraction
QuickData.ai excels at automating the extraction of critical financial data from complex documents. By processing rent rolls, T12 statements, and OMs, it eliminates the need for tedious manual entry, allowing users to focus on higher-value tasks.
14 Day Free Trial
To facilitate user onboarding, QuickData.ai offers a 14-day free trial. This allows potential customers to explore the extensive capabilities of the tool without any financial commitment, making it easier to assess its value for their specific needs.
One-on-One Onboarding Support
QuickData.ai provides personalized onboarding support to ensure users can quickly and effectively set up the tool. With free one-on-one sessions, users receive tailored guidance, enabling them to harness the full potential of the product from day one.
Use Cases
Dividend Data
Building a Dividend Growth Screening Model
Investors focused on dividend growth can use Dividend Data to create a powerful screening spreadsheet. By using functions to pull dividend growth rates, payout ratios, and earnings history for thousands of stocks, they can instantly filter for companies with a history of consistent, sustainable dividend increases. This automates the initial discovery phase, allowing for rapid identification of candidates that meet specific criteria for further due diligence.
Automating Monthly Portfolio Income Reports
For income-focused investors, manually tracking dividend payments across a portfolio is tedious. With Dividend Data, users can build a master portfolio sheet where each holding's ticker automatically pulls the next ex-dividend date, payment date, and declared dividend amount. This sheet can then forecast monthly and annual income, update live, and provide a clear, always-current view of cash flow expectations without any manual data entry.
Conducting Comparative Fundamental Analysis
Analysts and serious investors can perform deep-dive comparisons between companies. By using functions to pull side-by-side data on metrics like ROE, debt-to-equity, profit margins, and valuation multiples, they can build comprehensive comparison tables. The 30+ years of data allow for analyzing how these metrics have evolved over time, providing context that is essential for determining relative strength and long-term operational efficiency.
Creating Dynamic Financial Dashboards
Financial educators, bloggers, or investment club leaders can use Dividend Data to create interactive dashboards. They can build sheets that display key real-time stats for a watchlist, such as current price, dividend yield, and P/E ratio, which refresh automatically. This turns a simple spreadsheet into a live monitoring tool, perfect for presentations, educational content, or keeping a group informed with up-to-the-minute data.
QuickData.ai
Streamlining Underwriting Processes
Real estate professionals can utilize QuickData.ai to significantly expedite their underwriting processes. By automating data entry, users can swiftly analyze multiple deals, enhancing overall productivity and decision-making speed.
Enhancing Financial Modeling Accuracy
With QuickData.ai, users can ensure that their financial models are populated with accurate, structured data. This precision reduces the likelihood of errors that often accompany manual data entry, leading to more reliable financial analyses.
Increasing Deal Volume Analysis
By saving valuable time on data extraction, real estate teams can evaluate a higher volume of potential acquisitions. This increased capacity allows them to explore more opportunities and ultimately drives better investment decisions.
Supporting Financial Reporting
QuickData.ai simplifies the financial reporting process for accounting firms and real estate professionals. With accurate data readily available in Excel, users can quickly generate reports and insights, improving communication with stakeholders.
Overview
About Dividend Data
Dividend Data is a powerful financial data platform designed to democratize access to institutional-grade stock market information. At its core, it is a spreadsheet add-in that seamlessly integrates over 30 years of historical and real-time data for more than 80,000 tickers directly into Google Sheets and Microsoft Excel. The product eliminates the traditional barriers of complex APIs, coding requirements, and manual copy-pasting, delivering data through simple, custom formulas. Built specifically by and for dividend and fundamental investors, it provides instant access to a comprehensive suite of metrics including dividend histories, yields, payout ratios, growth rates, complete financial statements, earnings reports, valuation ratios, and price action. Its unique value proposition lies in its unparalleled ease of use combined with deep, reliable data, offering a professional analysis toolkit at a fraction of the cost of institutional terminals. With a generous free tier and robust paid plans, it serves both individual retail investors and professional analysts who seek to make informed, data-driven investment decisions without the steep learning curve or exorbitant price tag.
About QuickData.ai
QuickData.ai is a transformative solution in the multifamily real estate underwriting landscape, designed to streamline and enhance the data extraction process. This advanced Excel add-in leverages specialized artificial intelligence to automate the analysis of critical financial information from complex, unstructured documents such as rent rolls, trailing twelve-month (T12) statements, and offering memorandums (OMs). By alleviating the burden of manual data entry, QuickData.ai empowers professionals in acquisitions teams, commercial brokerage, lending institutions, and accounting firms to focus on strategic decision-making rather than time-consuming data transcription. The platform's main value proposition lies in its ability to drastically reduce the time spent on data extraction—saving users an average of 15 hours each month—while simultaneously minimizing human error. This efficiency enables users to analyze a higher volume of potential acquisitions and make informed decisions with greater confidence. QuickData.ai is engineered for those who demand precision and speed in their financial modeling processes, marking a significant shift towards intelligent workflows in the commercial real estate sector.
Frequently Asked Questions
Dividend Data FAQ
How does the free tier work and what are credits?
The free tier provides 2,500 credits per month that never expire, with no credit card required to start. Each data request made via a spreadsheet function consumes a small number of credits (typically 1-2 per call). This generous allowance allows users to perform substantial analysis and automation for free. It's designed to let investors fully test the platform's capabilities in their real-world workflows without a time-limited trial.
What kind of data can I access with the spreadsheet functions?
You can access a vast array of data points spanning dividends, quotes, fundamentals, and ratios. Specific examples include forward and historical dividend amounts/yields, ex-dividend and payment dates, current stock price, 30+ years of price history, complete financial statement items (revenue, EPS, cash flow), and over 100 pre-calculated financial ratios like P/E, P/B, and ROIC. The documentation provides a full list of all available metrics for each function.
Do I need to know how to code or set up an API?
Absolutely not. Dividend Data is built specifically to require zero coding or technical setup. There are no API keys to manage. After installing the add-in from the Google Workspace or Microsoft AppSource store, you simply use the provided custom formulas directly in your spreadsheet cells as you would any native function like =SUM(). The complexity of data sourcing and management is handled entirely in the background.
Is my data and portfolio information secure?
Yes. Dividend Data takes security seriously. The connection between your spreadsheet and their servers is secure. When using the portfolio tracking features in the Pro Terminal, your holdings data is stored privately. The company has a clear privacy policy and terms of use. Furthermore, as an official add-in listed on Google and Microsoft's marketplaces, it adheres to these platforms' security and compliance standards.
QuickData.ai FAQ
How does QuickData.ai integrate with existing Excel models?
QuickData.ai serves as an add-in for Excel, allowing users to seamlessly integrate automated data extraction into their current financial models without any disruption to existing workflows.
What types of documents can QuickData.ai process?
QuickData.ai can effectively process a variety of unstructured documents, including rent rolls, trailing twelve-month (T12) statements, and offering memorandums (OMs) to extract vital financial information.
Is there a commitment required to use the free trial?
No commitment is required to access the 14-day free trial of QuickData.ai. Users can cancel at any time during the trial period without any financial obligation.
What kind of support does QuickData.ai offer during onboarding?
QuickData.ai provides personalized, one-on-one onboarding support to all new users. This ensures that they are equipped with the knowledge and tools necessary to maximize the benefits of the software from the outset.
Alternatives
Dividend Data Alternatives
Dividend Data is a specialized financial data tool that provides extensive dividend and fundamental stock information directly within spreadsheet applications like Google Sheets and Excel. It falls into the category of self-service investment research platforms, designed to empower individual investors with deep, historical data sets. Users often explore alternatives for various reasons. Some may have specific budget constraints or require a different pricing model, while others might need features tailored to different investment strategies, such as technical analysis or real-time alerts. Platform compatibility is another key factor, as some investors prefer web-based dashboards, mobile apps, or integration with other software beyond spreadsheets. When evaluating other options, consider the depth and historical range of the data offered, the ease of access and integration into your existing workflow, and the overall cost relative to the value provided. The ideal solution should align with your primary investment methodology, whether it's dividend growth, value investing, or broader market analysis, without unnecessary complexity or expense.
QuickData.ai Alternatives
QuickData.ai is an innovative tool designed for the multifamily real estate sector, falling under the category of AI Assistants in Business & Finance. It automates the tedious process of data entry for rent rolls and T12 statements into Excel, significantly streamlining the underwriting process for commercial real estate professionals. Users often seek alternatives to QuickData.ai for various reasons, including pricing considerations, specific feature requirements, or compatibility with different platforms and workflows. When selecting an alternative to QuickData.ai, it’s essential to assess factors such as the accuracy of data extraction, the user interface, integration capabilities with existing systems, and overall cost-effectiveness. Additionally, evaluating customer support and community resources can greatly enhance the decision-making process, ensuring that the chosen solution meets the unique needs of users in the real estate industry.