Dividend Data vs echoloc
Side-by-side comparison to help you choose the right AI tool.
Dividend Data
Dividend Data instantly delivers stock dividends, prices, and financials directly into your Google Sheets or Excel spreadsheets.
Last updated: March 11, 2026
Echoloc uncovers buyer intent in job posts, enabling sales teams to target accounts ready to purchase.
Last updated: February 28, 2026
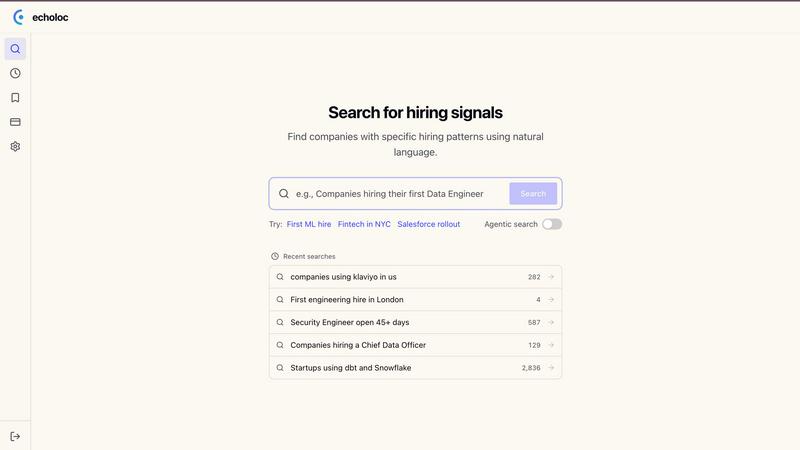
Visual Comparison
Dividend Data

echoloc
Feature Comparison
Dividend Data
Extensive Custom Spreadsheet Functions
Dividend Data provides a specialized library of 16+ custom functions, such as DIVIDENDDATA_DIVIDENDS and DIVIDENDDATA_RATIOS, that act as direct conduits to live financial data. Users simply type these formulas into any cell, referencing a stock ticker and desired metric, and the platform instantly populates the cell with accurate, updated information. This transforms static spreadsheets into dynamic, auto-updating financial dashboards, covering everything from forward dividend yields and ex-dates to P/E ratios and diluted EPS.
Deep Historical & Fundamental Data Library
The platform grants users access to a vast repository of over 30 years of historical market data. This is not limited to price history but extends deeply into fundamental analysis, including decades of dividend payments, annual and quarterly financial statements, and hundreds of key financial ratios. This long-term perspective is crucial for conducting thorough trend analysis, assessing a company's financial resilience through cycles, and building robust valuation models based on historical performance.
Multi-Platform Spreadsheet Integration
A key operational feature is its seamless compatibility with both Google Sheets and Microsoft Excel. Users are not locked into a single ecosystem; they can leverage Dividend Data's capabilities within their preferred spreadsheet environment. The add-ins are officially available on the Google Workspace Marketplace and Microsoft AppSource, ensuring easy installation, secure operation, and smooth performance whether working in the cloud with Sheets or locally with Excel.
AI-Powered Research & Portfolio Tools
Beyond spreadsheets, Dividend Data offers a web-based Terminal featuring advanced tools like an AI Analyst. This assistant can answer complex investment questions, generate research reports, and provide insights based on the platform's extensive dataset. Coupled with automated portfolio tracking that aggregates holdings, calculates projected income, and visualizes performance, it creates a holistic research and management suite for the modern investor.
echoloc
Real-time Job Analysis
Echoloc processes and analyzes over 10 million job postings and tracks 30 million companies, providing real-time updates on hiring signals. This continuous stream of data ensures that sales teams have access to the most current and relevant information, allowing them to make informed decisions when engaging potential buyers.
Evidence-Based Results
With Echoloc, each identified opportunity comes with proof in the form of snippets from job postings. This eliminates the guesswork involved in traditional prospecting methods. Sales professionals can see exactly why a company is a potential buyer, enhancing their outreach with concrete evidence that supports their approach.
Searchable Hiring Signals
Echoloc transforms job postings from mere HR tasks into actionable insights by making them searchable. Users can input queries in plain English to find specific hiring signals, such as companies looking for their first machine learning engineer. This intuitive search capability streamlines the process of identifying high-potential leads.
Comprehensive Filter Options
The platform offers a variety of filters that allow users to customize their search based on specific criteria. Whether looking for companies hiring for certain roles or those experiencing hiring spikes, Echoloc enables sales teams to pinpoint exactly what they need without complex training or setup.
Use Cases
Dividend Data
Building a Dividend Growth Screening Model
Investors focused on dividend growth can use Dividend Data to create a powerful screening spreadsheet. By using functions to pull dividend growth rates, payout ratios, and earnings history for thousands of stocks, they can instantly filter for companies with a history of consistent, sustainable dividend increases. This automates the initial discovery phase, allowing for rapid identification of candidates that meet specific criteria for further due diligence.
Automating Monthly Portfolio Income Reports
For income-focused investors, manually tracking dividend payments across a portfolio is tedious. With Dividend Data, users can build a master portfolio sheet where each holding's ticker automatically pulls the next ex-dividend date, payment date, and declared dividend amount. This sheet can then forecast monthly and annual income, update live, and provide a clear, always-current view of cash flow expectations without any manual data entry.
Conducting Comparative Fundamental Analysis
Analysts and serious investors can perform deep-dive comparisons between companies. By using functions to pull side-by-side data on metrics like ROE, debt-to-equity, profit margins, and valuation multiples, they can build comprehensive comparison tables. The 30+ years of data allow for analyzing how these metrics have evolved over time, providing context that is essential for determining relative strength and long-term operational efficiency.
Creating Dynamic Financial Dashboards
Financial educators, bloggers, or investment club leaders can use Dividend Data to create interactive dashboards. They can build sheets that display key real-time stats for a watchlist, such as current price, dividend yield, and P/E ratio, which refresh automatically. This turns a simple spreadsheet into a live monitoring tool, perfect for presentations, educational content, or keeping a group informed with up-to-the-minute data.
echoloc
Targeting High-Potential Leads
Sales teams can utilize Echoloc to identify companies that are hiring for critical roles, such as their first data engineer. This indicates a readiness to invest in new technologies, making these companies prime targets for outreach.
Competitive Advantage in Sales Outreach
By accessing insights before they become mainstream, sales professionals can reach out to potential buyers while competitors are still relying on outdated intent data. This timing advantage can lead to higher conversion rates and more successful sales engagements.
Data-Driven Decision Making
With the evidence provided by Echoloc, sales teams can base their outreach strategies on solid data rather than assumptions. This data-driven approach leads to more effective communication and a higher likelihood of closing deals.
Geographic Expansion Strategies
Echoloc helps companies identify opportunities in new regions by tracking job postings that signal geographic expansion, such as a first engineering hire in a new city. This can inform market entry strategies and regional sales initiatives.
Overview
About Dividend Data
Dividend Data is a powerful financial data platform designed to democratize access to institutional-grade stock market information. At its core, it is a spreadsheet add-in that seamlessly integrates over 30 years of historical and real-time data for more than 80,000 tickers directly into Google Sheets and Microsoft Excel. The product eliminates the traditional barriers of complex APIs, coding requirements, and manual copy-pasting, delivering data through simple, custom formulas. Built specifically by and for dividend and fundamental investors, it provides instant access to a comprehensive suite of metrics including dividend histories, yields, payout ratios, growth rates, complete financial statements, earnings reports, valuation ratios, and price action. Its unique value proposition lies in its unparalleled ease of use combined with deep, reliable data, offering a professional analysis toolkit at a fraction of the cost of institutional terminals. With a generous free tier and robust paid plans, it serves both individual retail investors and professional analysts who seek to make informed, data-driven investment decisions without the steep learning curve or exorbitant price tag.
About echoloc
Echoloc is an innovative platform that redefines how sales professionals discover and engage potential buyers by focusing on hiring signals. Unlike traditional methods of tracking buyer intent, which often rely on indirect indicators, Echoloc analyzes job postings to identify concrete buying signals that suggest companies are preparing to invest in new technologies or services. This approach is particularly beneficial for sales development representatives (SDRs), account executives (AEs), and revenue teams, as it allows them to identify opportunities well before they surface in conventional intent data sources. For example, a job posting for a first data engineer signals that a company is likely in a growth phase, indicating a willingness to spend on new solutions. By leveraging real-time job description data, Echoloc provides sales professionals with timely and evidence-based insights, enabling them to tailor their outreach strategies effectively and stay ahead of the competition.
Frequently Asked Questions
Dividend Data FAQ
How does the free tier work and what are credits?
The free tier provides 2,500 credits per month that never expire, with no credit card required to start. Each data request made via a spreadsheet function consumes a small number of credits (typically 1-2 per call). This generous allowance allows users to perform substantial analysis and automation for free. It's designed to let investors fully test the platform's capabilities in their real-world workflows without a time-limited trial.
What kind of data can I access with the spreadsheet functions?
You can access a vast array of data points spanning dividends, quotes, fundamentals, and ratios. Specific examples include forward and historical dividend amounts/yields, ex-dividend and payment dates, current stock price, 30+ years of price history, complete financial statement items (revenue, EPS, cash flow), and over 100 pre-calculated financial ratios like P/E, P/B, and ROIC. The documentation provides a full list of all available metrics for each function.
Do I need to know how to code or set up an API?
Absolutely not. Dividend Data is built specifically to require zero coding or technical setup. There are no API keys to manage. After installing the add-in from the Google Workspace or Microsoft AppSource store, you simply use the provided custom formulas directly in your spreadsheet cells as you would any native function like =SUM(). The complexity of data sourcing and management is handled entirely in the background.
Is my data and portfolio information secure?
Yes. Dividend Data takes security seriously. The connection between your spreadsheet and their servers is secure. When using the portfolio tracking features in the Pro Terminal, your holdings data is stored privately. The company has a clear privacy policy and terms of use. Furthermore, as an official add-in listed on Google and Microsoft's marketplaces, it adheres to these platforms' security and compliance standards.
echoloc FAQ
How does Echoloc identify buying signals?
Echoloc analyzes job postings to uncover hiring signals that suggest companies are preparing to invest in new technologies or services. This direct approach provides actionable insights for sales teams.
What types of roles can I track with Echoloc?
Users can track a wide range of roles, from engineering positions to sales leadership, allowing them to identify specific hiring patterns and potential buying signals in various industries.
Is there a limit to the number of job postings I can analyze?
Echoloc provides access to a vast database of job postings, enabling users to conduct extensive searches without restrictions on the number of postings analyzed.
How frequently is the data updated?
Echoloc offers real-time updates, ensuring that sales professionals have access to the most current hiring signals and job postings, which is crucial for timely outreach and engagement.
Alternatives
Dividend Data Alternatives
Dividend Data is a specialized financial data tool that provides extensive dividend and fundamental stock information directly within spreadsheet applications like Google Sheets and Excel. It falls into the category of self-service investment research platforms, designed to empower individual investors with deep, historical data sets. Users often explore alternatives for various reasons. Some may have specific budget constraints or require a different pricing model, while others might need features tailored to different investment strategies, such as technical analysis or real-time alerts. Platform compatibility is another key factor, as some investors prefer web-based dashboards, mobile apps, or integration with other software beyond spreadsheets. When evaluating other options, consider the depth and historical range of the data offered, the ease of access and integration into your existing workflow, and the overall cost relative to the value provided. The ideal solution should align with your primary investment methodology, whether it's dividend growth, value investing, or broader market analysis, without unnecessary complexity or expense.
echoloc Alternatives
Echoloc is an innovative platform that empowers sales professionals by identifying buying signals in job postings. It falls under the Business & Finance category, specifically targeting sales development representatives and account executives. Users often seek alternatives to Echoloc for various reasons, including pricing, feature sets, or specific platform needs that may better align with their workflows. When evaluating alternatives, it's essential to consider the scope of features offered, the adaptability of the platform to your existing sales processes, and the overall cost-effectiveness in relation to your team’s requirements. In today's competitive sales landscape, the ability to stay ahead of potential buyers is crucial. Therefore, when choosing an alternative, pay attention to the comprehensiveness of data analysis, the accuracy of signals detected, and support for integration with other sales tools. A platform that can provide timely insights and align with your sales strategies can make all the difference in achieving your revenue goals.