aVenture vs Dividend Data
Side-by-side comparison to help you choose the right AI tool.
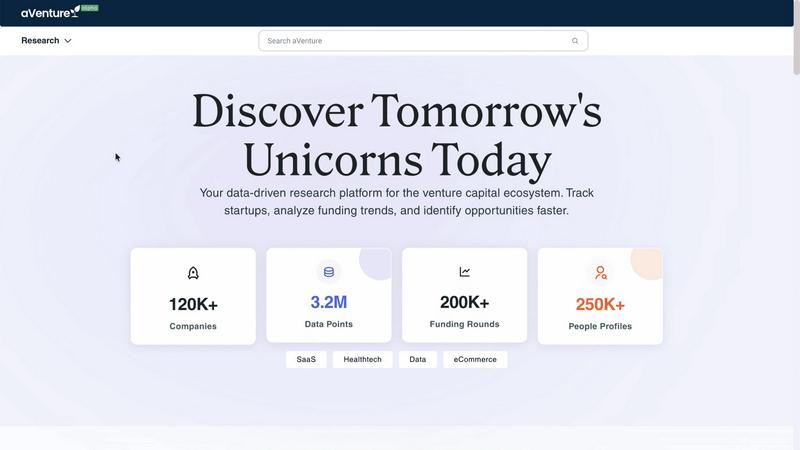
aVenture is an AI platform providing institutional-grade insights on private companies and venture capital markets.
Last updated: March 1, 2026
Dividend Data
Dividend Data instantly delivers stock dividends, prices, and financials directly into your Google Sheets or Excel spreadsheets.
Last updated: March 11, 2026
Visual Comparison
aVenture
Dividend Data

Feature Comparison
aVenture
Comprehensive Company Tracking
aVenture provides users with the ability to track ownership structures, funding histories, and competitive positioning across more than 100,000 venture-backed companies, ensuring that institutional investors have access to the insights they need for informed decision-making.
AI-Powered Insights
The platform includes an advanced AI analyst that scans the latest news and coverage to deliver real-time insights. This feature allows users to understand a company's traction, evaluate risks, and predict how external events may affect its trajectory, transforming raw data into actionable intelligence.
Extensive Data Aggregation
With over 12.8 million data points sourced from more than 1,200 unique data sources, aVenture aggregates a wealth of information that empowers users to conduct thorough analyses of market trends, funding rounds, and emerging startups.
User-Centric Workspace
aVenture offers a seamless user experience with a powerful workspace designed for collaboration. Users can discover opportunities, map ecosystems, and track relevant signals in a single interface, enhancing the efficiency of their research processes.
Dividend Data
Extensive Custom Spreadsheet Functions
Dividend Data provides a specialized library of 16+ custom functions, such as DIVIDENDDATA_DIVIDENDS and DIVIDENDDATA_RATIOS, that act as direct conduits to live financial data. Users simply type these formulas into any cell, referencing a stock ticker and desired metric, and the platform instantly populates the cell with accurate, updated information. This transforms static spreadsheets into dynamic, auto-updating financial dashboards, covering everything from forward dividend yields and ex-dates to P/E ratios and diluted EPS.
Deep Historical & Fundamental Data Library
The platform grants users access to a vast repository of over 30 years of historical market data. This is not limited to price history but extends deeply into fundamental analysis, including decades of dividend payments, annual and quarterly financial statements, and hundreds of key financial ratios. This long-term perspective is crucial for conducting thorough trend analysis, assessing a company's financial resilience through cycles, and building robust valuation models based on historical performance.
Multi-Platform Spreadsheet Integration
A key operational feature is its seamless compatibility with both Google Sheets and Microsoft Excel. Users are not locked into a single ecosystem; they can leverage Dividend Data's capabilities within their preferred spreadsheet environment. The add-ins are officially available on the Google Workspace Marketplace and Microsoft AppSource, ensuring easy installation, secure operation, and smooth performance whether working in the cloud with Sheets or locally with Excel.
AI-Powered Research & Portfolio Tools
Beyond spreadsheets, Dividend Data offers a web-based Terminal featuring advanced tools like an AI Analyst. This assistant can answer complex investment questions, generate research reports, and provide insights based on the platform's extensive dataset. Coupled with automated portfolio tracking that aggregates holdings, calculates projected income, and visualizes performance, it creates a holistic research and management suite for the modern investor.
Use Cases
aVenture
Venture Capital Due Diligence
Venture capitalists can leverage aVenture to conduct comprehensive due diligence on potential investments by accessing deep insights into company performance, funding histories, and competitive landscapes, ultimately leading to more informed investment decisions.
Fundraising Preparation for Founders
Founders preparing for fundraising rounds can utilize aVenture to gather critical data on market trends and investor interests, enabling them to craft compelling pitches and strategically position their companies for success.
Business Development and Partnership Scouting
Business development teams can use aVenture to scout for potential partners by analyzing the competitive positioning and funding histories of target companies. This helps in identifying strategic collaborations that can enhance business growth.
Market Analysis and Competitive Landscapes
Market analysts can harness aVenture's extensive data to build competitive landscapes and monitor industry trends. This capability supports the development of strategic insights that drive corporate planning and market positioning.
Dividend Data
Building a Dividend Growth Screening Model
Investors focused on dividend growth can use Dividend Data to create a powerful screening spreadsheet. By using functions to pull dividend growth rates, payout ratios, and earnings history for thousands of stocks, they can instantly filter for companies with a history of consistent, sustainable dividend increases. This automates the initial discovery phase, allowing for rapid identification of candidates that meet specific criteria for further due diligence.
Automating Monthly Portfolio Income Reports
For income-focused investors, manually tracking dividend payments across a portfolio is tedious. With Dividend Data, users can build a master portfolio sheet where each holding's ticker automatically pulls the next ex-dividend date, payment date, and declared dividend amount. This sheet can then forecast monthly and annual income, update live, and provide a clear, always-current view of cash flow expectations without any manual data entry.
Conducting Comparative Fundamental Analysis
Analysts and serious investors can perform deep-dive comparisons between companies. By using functions to pull side-by-side data on metrics like ROE, debt-to-equity, profit margins, and valuation multiples, they can build comprehensive comparison tables. The 30+ years of data allow for analyzing how these metrics have evolved over time, providing context that is essential for determining relative strength and long-term operational efficiency.
Creating Dynamic Financial Dashboards
Financial educators, bloggers, or investment club leaders can use Dividend Data to create interactive dashboards. They can build sheets that display key real-time stats for a watchlist, such as current price, dividend yield, and P/E ratio, which refresh automatically. This turns a simple spreadsheet into a live monitoring tool, perfect for presentations, educational content, or keeping a group informed with up-to-the-minute data.
Overview
About aVenture
aVenture is an institutional-grade venture intelligence platform designed to revolutionize the way professionals conduct research in private markets. With its comprehensive data engine, aVenture tracks over 109,000 active venture-backed companies across 132 countries, aggregating insights from more than 1,200 sources to deliver an extensive database of over 12.8 million data points. The platform features an AI analyst that continuously monitors the latest news and developments, providing users with dynamic insights that go beyond static data. This AI capability summarizes company traction, identifies potential risks, and evaluates how new events could influence future performance. aVenture caters to a diverse audience, including venture capitalists performing due diligence, founders preparing for fundraising, business development teams scouting for potential partners, and market analysts mapping competitive landscapes. The core value proposition of aVenture lies in its ability to deliver precision, contextual information, and efficiency, allowing users to discover investment opportunities, track material signals, and collaborate seamlessly within a single, powerful workspace.
About Dividend Data
Dividend Data is a powerful financial data platform designed to democratize access to institutional-grade stock market information. At its core, it is a spreadsheet add-in that seamlessly integrates over 30 years of historical and real-time data for more than 80,000 tickers directly into Google Sheets and Microsoft Excel. The product eliminates the traditional barriers of complex APIs, coding requirements, and manual copy-pasting, delivering data through simple, custom formulas. Built specifically by and for dividend and fundamental investors, it provides instant access to a comprehensive suite of metrics including dividend histories, yields, payout ratios, growth rates, complete financial statements, earnings reports, valuation ratios, and price action. Its unique value proposition lies in its unparalleled ease of use combined with deep, reliable data, offering a professional analysis toolkit at a fraction of the cost of institutional terminals. With a generous free tier and robust paid plans, it serves both individual retail investors and professional analysts who seek to make informed, data-driven investment decisions without the steep learning curve or exorbitant price tag.
Frequently Asked Questions
aVenture FAQ
What types of companies does aVenture track?
aVenture tracks over 109,000 active venture-backed companies across 132 countries, providing comprehensive insights into a wide range of sectors and industries.
How does aVenture's AI analyst work?
The AI analyst within aVenture scans the latest news and developments, summarizing key information about companies. It highlights traction, identifies risks, and assesses how new events may influence a company's future, thus transforming data into actionable insights.
Who are the primary users of aVenture?
aVenture serves a diverse user base including venture capitalists, founders, business development teams, and market analysts, each leveraging the platform's capabilities for their specific needs in private market research.
What makes aVenture different from other research platforms?
aVenture stands out due to its integration of real-time AI-powered insights, extensive data aggregation from numerous sources, and a user-centric workspace that facilitates collaboration and efficient research, providing a comprehensive solution for venture intelligence.
Dividend Data FAQ
How does the free tier work and what are credits?
The free tier provides 2,500 credits per month that never expire, with no credit card required to start. Each data request made via a spreadsheet function consumes a small number of credits (typically 1-2 per call). This generous allowance allows users to perform substantial analysis and automation for free. It's designed to let investors fully test the platform's capabilities in their real-world workflows without a time-limited trial.
What kind of data can I access with the spreadsheet functions?
You can access a vast array of data points spanning dividends, quotes, fundamentals, and ratios. Specific examples include forward and historical dividend amounts/yields, ex-dividend and payment dates, current stock price, 30+ years of price history, complete financial statement items (revenue, EPS, cash flow), and over 100 pre-calculated financial ratios like P/E, P/B, and ROIC. The documentation provides a full list of all available metrics for each function.
Do I need to know how to code or set up an API?
Absolutely not. Dividend Data is built specifically to require zero coding or technical setup. There are no API keys to manage. After installing the add-in from the Google Workspace or Microsoft AppSource store, you simply use the provided custom formulas directly in your spreadsheet cells as you would any native function like =SUM(). The complexity of data sourcing and management is handled entirely in the background.
Is my data and portfolio information secure?
Yes. Dividend Data takes security seriously. The connection between your spreadsheet and their servers is secure. When using the portfolio tracking features in the Pro Terminal, your holdings data is stored privately. The company has a clear privacy policy and terms of use. Furthermore, as an official add-in listed on Google and Microsoft's marketplaces, it adheres to these platforms' security and compliance standards.
Alternatives
aVenture Alternatives
aVenture is an advanced AI platform that specializes in institutional-grade research on private companies and venture capital markets. By offering a comprehensive data engine that tracks over 109,000 active venture-backed companies, aVenture is designed to meet the needs of diverse professionals, from venture capitalists to market analysts. Users often seek alternatives to aVenture due to factors like pricing, specific feature sets, or varying platform requirements that better align with their unique workflows and objectives. When considering alternatives to aVenture, it is essential to evaluate key aspects such as data coverage, ease of use, integration capabilities, and the level of analytical support offered. Assessing whether the platform can deliver actionable insights tailored to your specific needs is also crucial. A thorough comparison of features, user experience, and overall value will help you find the best solution for your research and investment processes.
Dividend Data Alternatives
Dividend Data is a specialized financial data tool that provides extensive dividend and fundamental stock information directly within spreadsheet applications like Google Sheets and Excel. It falls into the category of self-service investment research platforms, designed to empower individual investors with deep, historical data sets. Users often explore alternatives for various reasons. Some may have specific budget constraints or require a different pricing model, while others might need features tailored to different investment strategies, such as technical analysis or real-time alerts. Platform compatibility is another key factor, as some investors prefer web-based dashboards, mobile apps, or integration with other software beyond spreadsheets. When evaluating other options, consider the depth and historical range of the data offered, the ease of access and integration into your existing workflow, and the overall cost relative to the value provided. The ideal solution should align with your primary investment methodology, whether it's dividend growth, value investing, or broader market analysis, without unnecessary complexity or expense.