Dividend Data vs Redbark
Side-by-side comparison to help you choose the right AI tool.
Dividend Data
Dividend Data instantly delivers stock dividends, prices, and financials directly into your Google Sheets or Excel spreadsheets.
Last updated: March 11, 2026
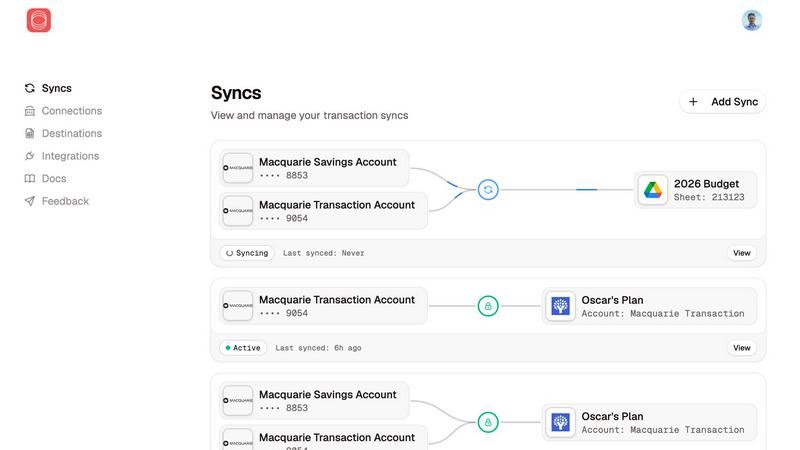
Redbark automatically syncs your Australian bank data to Google Sheets and YNAB in real time.
Last updated: March 4, 2026
Visual Comparison
Dividend Data

Redbark
Feature Comparison
Dividend Data
Extensive Custom Spreadsheet Functions
Dividend Data provides a specialized library of 16+ custom functions, such as DIVIDENDDATA_DIVIDENDS and DIVIDENDDATA_RATIOS, that act as direct conduits to live financial data. Users simply type these formulas into any cell, referencing a stock ticker and desired metric, and the platform instantly populates the cell with accurate, updated information. This transforms static spreadsheets into dynamic, auto-updating financial dashboards, covering everything from forward dividend yields and ex-dates to P/E ratios and diluted EPS.
Deep Historical & Fundamental Data Library
The platform grants users access to a vast repository of over 30 years of historical market data. This is not limited to price history but extends deeply into fundamental analysis, including decades of dividend payments, annual and quarterly financial statements, and hundreds of key financial ratios. This long-term perspective is crucial for conducting thorough trend analysis, assessing a company's financial resilience through cycles, and building robust valuation models based on historical performance.
Multi-Platform Spreadsheet Integration
A key operational feature is its seamless compatibility with both Google Sheets and Microsoft Excel. Users are not locked into a single ecosystem; they can leverage Dividend Data's capabilities within their preferred spreadsheet environment. The add-ins are officially available on the Google Workspace Marketplace and Microsoft AppSource, ensuring easy installation, secure operation, and smooth performance whether working in the cloud with Sheets or locally with Excel.
AI-Powered Research & Portfolio Tools
Beyond spreadsheets, Dividend Data offers a web-based Terminal featuring advanced tools like an AI Analyst. This assistant can answer complex investment questions, generate research reports, and provide insights based on the platform's extensive dataset. Coupled with automated portfolio tracking that aggregates holdings, calculates projected income, and visualizes performance, it creates a holistic research and management suite for the modern investor.
Redbark
Pass-Through Data Architecture
This foundational feature ensures maximum privacy and security by design. Your sensitive financial data—transactions, balances, account details—never lands on or passes through Redbark's permanent storage. It flows directly from your bank or brokerage to your chosen destination like Google Sheets or YNAB. This architecture minimizes data liability, aligns with strict data sovereignty principles, and guarantees that Redbark cannot view, sell, or retain your personal financial information, setting a new standard for trust in financial data piping.
Multi-Destination & Multi-Account Support
Redbark provides unparalleled flexibility in data routing. You can sync a single bank account to multiple destinations simultaneously—for instance, sending transactions to both a Google Sheets ledger and your YNAB budget, each with customized formatting. Conversely, you can direct different accounts (e.g., savings, credit card, loan) to separate sheets or databases within one destination. This granular control allows for sophisticated, organized financial systems tailored to complex personal or business needs without creating data silos.
Automated Background Sync with Smart Deduplication
Moving beyond manual refreshes, Redbark employs automated background syncing triggered by bank webhooks where possible, pushing new transactions in near real-time. This is paired with intelligent, ID-based deduplication logic that includes overlap buffers to catch late-posting transactions. The result is a constantly updated dataset in your tools where you never have to worry about duplicate entries or missing data, ensuring the integrity and accuracy of your financial records is maintained automatically.
Secure, Regulated Connectivity (CDR & Open Banking)
Redbark prioritizes secure, compliant access over outdated methods. For Australian banks, it uses the official Consumer Data Right (CDR) framework via an ACCC-accredited intermediary like Fiskil. This means connections are bank-approved, regulated, and transparent, with clear consumer consent and revocation rights. For global brokerages and NZ banks, it uses secure API providers like SnapTrade and Akahu. This approach eliminates the risks and instability of screen-scraping, providing a reliable and future-proof connection channel.
Use Cases
Dividend Data
Building a Dividend Growth Screening Model
Investors focused on dividend growth can use Dividend Data to create a powerful screening spreadsheet. By using functions to pull dividend growth rates, payout ratios, and earnings history for thousands of stocks, they can instantly filter for companies with a history of consistent, sustainable dividend increases. This automates the initial discovery phase, allowing for rapid identification of candidates that meet specific criteria for further due diligence.
Automating Monthly Portfolio Income Reports
For income-focused investors, manually tracking dividend payments across a portfolio is tedious. With Dividend Data, users can build a master portfolio sheet where each holding's ticker automatically pulls the next ex-dividend date, payment date, and declared dividend amount. This sheet can then forecast monthly and annual income, update live, and provide a clear, always-current view of cash flow expectations without any manual data entry.
Conducting Comparative Fundamental Analysis
Analysts and serious investors can perform deep-dive comparisons between companies. By using functions to pull side-by-side data on metrics like ROE, debt-to-equity, profit margins, and valuation multiples, they can build comprehensive comparison tables. The 30+ years of data allow for analyzing how these metrics have evolved over time, providing context that is essential for determining relative strength and long-term operational efficiency.
Creating Dynamic Financial Dashboards
Financial educators, bloggers, or investment club leaders can use Dividend Data to create interactive dashboards. They can build sheets that display key real-time stats for a watchlist, such as current price, dividend yield, and P/E ratio, which refresh automatically. This turns a simple spreadsheet into a live monitoring tool, perfect for presentations, educational content, or keeping a group informed with up-to-the-minute data.
Redbark
Automated Business Cash Flow Management
Small business owners and freelancers can automate their bookkeeping and cash flow tracking. By connecting their business transaction accounts, Redbark automatically pipes all income and expenses into a Google Sheets or Airtable database. This eliminates manual data entry from bank statements, enabling real-time profit/loss views, automated invoice reconciliation, and streamlined reporting for accountants, all within a customizable and familiar spreadsheet environment.
Consolidated Investment Portfolio Dashboard
Investors with holdings across multiple platforms (e.g., CommSec for ASX shares, Stake for US stocks, a crypto exchange) can unify their portfolio view. Redbark syncs holding and transaction data from each brokerage into a single Google Sheets workbook. This allows for the creation of a live, custom dashboard that tracks total portfolio value, asset allocation, performance across accounts, and dividend income without logging into multiple websites or handling CSV files.
Personal Budgeting with Live Bank Data
Individuals seeking control over their finances can supercharge budgeting apps like YNAB or Actual Budget. Instead of manually entering transactions, Redbark automatically syncs spending from all connected accounts (checking, savings, credit cards) directly into the budget. This provides a true, real-time picture of category balances and spending against budget goals, removing the friction that often causes budgeting efforts to fail and turning intention into effortless habit.
Financial Reporting and Data Analysis
Financial analysts, consultants, or savvy individuals can build powerful, automated reports. By streaming clean, deduplicated transaction data into Google Sheets or Notion databases, users can leverage formulas, pivot tables, and connected data visualization tools to generate monthly spending reports, analyze expense categories over time, track tax-deductible items, or model future savings scenarios—all with data that updates itself, turning static reports into dynamic financial insights engines.
Overview
About Dividend Data
Dividend Data is a powerful financial data platform designed to democratize access to institutional-grade stock market information. At its core, it is a spreadsheet add-in that seamlessly integrates over 30 years of historical and real-time data for more than 80,000 tickers directly into Google Sheets and Microsoft Excel. The product eliminates the traditional barriers of complex APIs, coding requirements, and manual copy-pasting, delivering data through simple, custom formulas. Built specifically by and for dividend and fundamental investors, it provides instant access to a comprehensive suite of metrics including dividend histories, yields, payout ratios, growth rates, complete financial statements, earnings reports, valuation ratios, and price action. Its unique value proposition lies in its unparalleled ease of use combined with deep, reliable data, offering a professional analysis toolkit at a fraction of the cost of institutional terminals. With a generous free tier and robust paid plans, it serves both individual retail investors and professional analysts who seek to make informed, data-driven investment decisions without the steep learning curve or exorbitant price tag.
About Redbark
Redbark redefines financial data management by acting as a secure, intelligent conduit between your money and your productivity tools. It solves a universal pain point: the tedious, error-prone process of manually exporting, downloading, and importing financial data from banks and brokerages into spreadsheets or budgeting apps. By leveraging Australia's official Consumer Data Right (CDR) framework and global brokerage integrations, Redbark provides a bank-approved, secure alternative to risky screen-scraping. Its core innovation is a privacy-first, pass-through architecture where your transaction, balance, and investment data flows directly from your financial institution to destinations like Google Sheets, Notion, YNAB, and Airtable without ever being stored on Redbark's servers. This automated sync, controlled on your schedule, delivers real-time financial visibility. Designed for simplicity without code, it empowers a diverse user base: freelancers automating invoice tracking, investors monitoring multi-asset portfolios, small business owners gaining instant cash flow clarity, and personal finance enthusiasts building custom dashboards. Ultimately, Redbark isn't just a connector; it's a foundational layer for financial automation, turning fragmented data into actionable insight within the tools you already trust.
Frequently Asked Questions
Dividend Data FAQ
How does the free tier work and what are credits?
The free tier provides 2,500 credits per month that never expire, with no credit card required to start. Each data request made via a spreadsheet function consumes a small number of credits (typically 1-2 per call). This generous allowance allows users to perform substantial analysis and automation for free. It's designed to let investors fully test the platform's capabilities in their real-world workflows without a time-limited trial.
What kind of data can I access with the spreadsheet functions?
You can access a vast array of data points spanning dividends, quotes, fundamentals, and ratios. Specific examples include forward and historical dividend amounts/yields, ex-dividend and payment dates, current stock price, 30+ years of price history, complete financial statement items (revenue, EPS, cash flow), and over 100 pre-calculated financial ratios like P/E, P/B, and ROIC. The documentation provides a full list of all available metrics for each function.
Do I need to know how to code or set up an API?
Absolutely not. Dividend Data is built specifically to require zero coding or technical setup. There are no API keys to manage. After installing the add-in from the Google Workspace or Microsoft AppSource store, you simply use the provided custom formulas directly in your spreadsheet cells as you would any native function like =SUM(). The complexity of data sourcing and management is handled entirely in the background.
Is my data and portfolio information secure?
Yes. Dividend Data takes security seriously. The connection between your spreadsheet and their servers is secure. When using the portfolio tracking features in the Pro Terminal, your holdings data is stored privately. The company has a clear privacy policy and terms of use. Furthermore, as an official add-in listed on Google and Microsoft's marketplaces, it adheres to these platforms' security and compliance standards.
Redbark FAQ
Is my financial data stored on Redbark's servers?
No. Redbark uses a unique pass-through data architecture. Your sensitive data—including transaction details, account balances, and holdings—flows directly from your financial institution (your bank or brokerage) to your chosen destination (like Google Sheets or YNAB). Redbark acts only as the secure conduit facilitating this connection and does not store your financial data on its servers, ensuring maximum privacy and data minimization.
How does Redbark connect to my bank, and is it safe?
For Australian banks, Redbark connects exclusively via the Consumer Data Right (CDR) framework through an ACCC-accredited data recipient partner. This is the official, government-regulated open banking system, not screen-scraping. It is bank-approved, requires your explicit consent, and you can revoke access at any time. For global brokerages, secure API providers like SnapTrade are used. All credentials are encrypted with AES-256, and the entire infrastructure is hosted in Australia.
Can I sync data to multiple tools at once?
Yes, Redbark's multi-destination support is a key feature. You can configure a single bank or investment account to sync simultaneously to multiple endpoints. For example, you could send your transaction data to a Google Sheets spreadsheet for custom analysis, to YNAB for budgeting, and to a Notion database for logging—all from the same source connection, with the ability to customize the format for each destination.
What happens if my bank isn't listed as supported?
Redbark supports over 100 Australian financial institutions via the CDR system, covering all major banks and many credit unions. If your Australian bank participates in CDR (most do), it will be supported. For non-Australian banks or specific institutions, support depends on partnerships with API providers like Akahu for New Zealand. The connections page on the Redbark website provides the most current and comprehensive list of supported institutions.
Alternatives
Dividend Data Alternatives
Dividend Data is a specialized financial data tool that provides extensive dividend and fundamental stock information directly within spreadsheet applications like Google Sheets and Excel. It falls into the category of self-service investment research platforms, designed to empower individual investors with deep, historical data sets. Users often explore alternatives for various reasons. Some may have specific budget constraints or require a different pricing model, while others might need features tailored to different investment strategies, such as technical analysis or real-time alerts. Platform compatibility is another key factor, as some investors prefer web-based dashboards, mobile apps, or integration with other software beyond spreadsheets. When evaluating other options, consider the depth and historical range of the data offered, the ease of access and integration into your existing workflow, and the overall cost relative to the value provided. The ideal solution should align with your primary investment methodology, whether it's dividend growth, value investing, or broader market analysis, without unnecessary complexity or expense.
Redbark Alternatives
Redbark is a financial data automation tool that securely syncs transaction and investment data from Australian banks and global brokerages directly into apps like Google Sheets and Notion. It operates within the personal and business finance category, focusing on eliminating manual data entry through automated, secure connections. Users often explore alternatives for various reasons. These can include budget constraints, a need for different integration platforms beyond what's offered, or specific feature requirements like more advanced reporting, support for non-Australian financial institutions, or a different user interface. The search is typically driven by finding the perfect fit for one's unique financial workflow and tech stack. When evaluating other options, key considerations should be security methodology, the range of supported banks and destinations, automation reliability, and overall value for money. It's crucial to assess how the tool accesses your data, ensuring it uses official, secure APIs rather than less reliable methods, and that it aligns with your need for simplicity or advanced functionality.