Dividend Data vs GrowPanel
Side-by-side comparison to help you choose the right AI tool.
Dividend Data
Dividend Data instantly delivers stock dividends, prices, and financials directly into your Google Sheets or Excel spreadsheets.
Last updated: March 11, 2026
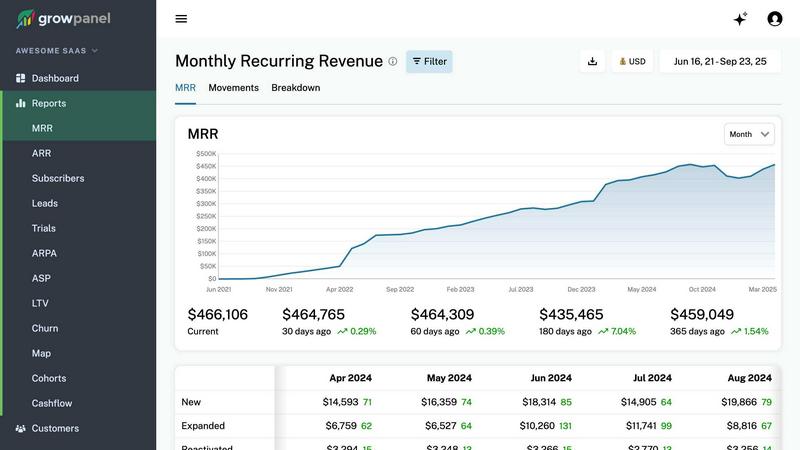
GrowPanel
GrowPanel delivers real-time subscription analytics to help SaaS businesses grow smarter.
Last updated: February 28, 2026
Visual Comparison
Dividend Data

GrowPanel
Feature Comparison
Dividend Data
Extensive Custom Spreadsheet Functions
Dividend Data provides a specialized library of 16+ custom functions, such as DIVIDENDDATA_DIVIDENDS and DIVIDENDDATA_RATIOS, that act as direct conduits to live financial data. Users simply type these formulas into any cell, referencing a stock ticker and desired metric, and the platform instantly populates the cell with accurate, updated information. This transforms static spreadsheets into dynamic, auto-updating financial dashboards, covering everything from forward dividend yields and ex-dates to P/E ratios and diluted EPS.
Deep Historical & Fundamental Data Library
The platform grants users access to a vast repository of over 30 years of historical market data. This is not limited to price history but extends deeply into fundamental analysis, including decades of dividend payments, annual and quarterly financial statements, and hundreds of key financial ratios. This long-term perspective is crucial for conducting thorough trend analysis, assessing a company's financial resilience through cycles, and building robust valuation models based on historical performance.
Multi-Platform Spreadsheet Integration
A key operational feature is its seamless compatibility with both Google Sheets and Microsoft Excel. Users are not locked into a single ecosystem; they can leverage Dividend Data's capabilities within their preferred spreadsheet environment. The add-ins are officially available on the Google Workspace Marketplace and Microsoft AppSource, ensuring easy installation, secure operation, and smooth performance whether working in the cloud with Sheets or locally with Excel.
AI-Powered Research & Portfolio Tools
Beyond spreadsheets, Dividend Data offers a web-based Terminal featuring advanced tools like an AI Analyst. This assistant can answer complex investment questions, generate research reports, and provide insights based on the platform's extensive dataset. Coupled with automated portfolio tracking that aggregates holdings, calculates projected income, and visualizes performance, it creates a holistic research and management suite for the modern investor.
GrowPanel
Real-Time Subscription Analytics Dashboard
GrowPanel provides instant, real-time visibility into the core health metrics of your SaaS business. The dashboard automatically tracks and visualizes MRR, ARR, churn, LTV, and customer lifetime, updating continuously as transactions occur. This allows teams to monitor daily, weekly, or monthly trends with smooth normalization, moving beyond stale, end-of-month reports to a dynamic, always-current view of business performance that supports fast, confident decision-making.
Advanced Cohort and Segmentation Analysis
This feature allows you to move beyond top-line numbers and understand the nuanced behavior of different customer groups. You can create flexible cohorts based on plan, country, currency, billing frequency, or custom attributes. Track trial conversion patterns, visualize retention curves over time, and identify churn reasons with intuitive pie charts. This deep analysis helps pinpoint growth opportunities, assess customer concentration risk, and tailor strategies to specific market segments for improved retention and expansion.
Comprehensive Cashflow and Revenue Reporting
GrowPanel offers granular financial oversight by tracking every component of your revenue stream. It meticulously monitors not just recurring revenue, but also one-time charges, refunds, discounts, processing fees, taxes, and foreign exchange gains or losses. Crucially, it includes failed payment tracking with recovery insights to combat involuntary churn. This holistic view enables precise cashflow management, helps spot seasonal trends, and allows you to project your end-of-month financial position with greater confidence.
AI-Powered Chat and Automated Insights
Stop navigating complex filters and simply ask your data questions in plain language. The integrated AI chat understands SaaS terminology, allowing you to query metrics like "What's our churn rate in Europe this quarter?" or "Show expansion revenue by plan" for instant, conversational answers. You can drill down dynamically and save these insights as reports. This is complemented by automated Slack/Teams alerts and scheduled email reports, ensuring key stakeholders stay informed effortlessly without manual intervention.
Use Cases
Dividend Data
Building a Dividend Growth Screening Model
Investors focused on dividend growth can use Dividend Data to create a powerful screening spreadsheet. By using functions to pull dividend growth rates, payout ratios, and earnings history for thousands of stocks, they can instantly filter for companies with a history of consistent, sustainable dividend increases. This automates the initial discovery phase, allowing for rapid identification of candidates that meet specific criteria for further due diligence.
Automating Monthly Portfolio Income Reports
For income-focused investors, manually tracking dividend payments across a portfolio is tedious. With Dividend Data, users can build a master portfolio sheet where each holding's ticker automatically pulls the next ex-dividend date, payment date, and declared dividend amount. This sheet can then forecast monthly and annual income, update live, and provide a clear, always-current view of cash flow expectations without any manual data entry.
Conducting Comparative Fundamental Analysis
Analysts and serious investors can perform deep-dive comparisons between companies. By using functions to pull side-by-side data on metrics like ROE, debt-to-equity, profit margins, and valuation multiples, they can build comprehensive comparison tables. The 30+ years of data allow for analyzing how these metrics have evolved over time, providing context that is essential for determining relative strength and long-term operational efficiency.
Creating Dynamic Financial Dashboards
Financial educators, bloggers, or investment club leaders can use Dividend Data to create interactive dashboards. They can build sheets that display key real-time stats for a watchlist, such as current price, dividend yield, and P/E ratio, which refresh automatically. This turns a simple spreadsheet into a live monitoring tool, perfect for presentations, educational content, or keeping a group informed with up-to-the-minute data.
GrowPanel
For SaaS Founders Seeking Operational Clarity
Founders and CEOs use GrowPanel to gain an immediate, unambiguous view of their company's financial trajectory without getting bogged down in data aggregation. The real-time dashboards and AI chat function provide a quick, CEO-friendly snapshot of MRR growth, churn, and cashflow, replacing weekly spreadsheet updates and enabling faster strategic pivots based on live data, much like having a built-in SaaS CFO.
For Finance Teams Automating Revenue Operations
Finance and operations teams leverage GrowPanel to automate the entire revenue reporting process. By connecting the billing platform, they eliminate manual data pulls and reconciliation errors. The platform's detailed cashflow reporting, including fees, taxes, and FX, provides accurate financial statements, while automated scheduled reports ensure investors and board members receive consistent, reliable updates without manual effort.
For Growth and Product Teams Optimizing Conversion
Product managers and growth marketers utilize the cohort and trial analysis features to understand user behavior deeply. They can segment users who signed up during a specific campaign or on a particular plan, track their conversion from trial to paid, and analyze long-term retention. These insights directly inform experiments to improve trial conversion rates, reduce early-stage churn, and design pricing plans that maximize customer lifetime value.
For Customer Success Managing Retention and Expansion
Customer Success teams rely on GrowPanel to proactively manage accounts and drive expansion revenue. Revenue segmentation and cohort analysis help identify at-risk customer segments based on plan or region. Tracking expansion revenue separately highlights successful upselling motions. This data allows teams to target interventions more effectively, improve retention rates, and build strategies to grow revenue within the existing customer base.
Overview
About Dividend Data
Dividend Data is a powerful financial data platform designed to democratize access to institutional-grade stock market information. At its core, it is a spreadsheet add-in that seamlessly integrates over 30 years of historical and real-time data for more than 80,000 tickers directly into Google Sheets and Microsoft Excel. The product eliminates the traditional barriers of complex APIs, coding requirements, and manual copy-pasting, delivering data through simple, custom formulas. Built specifically by and for dividend and fundamental investors, it provides instant access to a comprehensive suite of metrics including dividend histories, yields, payout ratios, growth rates, complete financial statements, earnings reports, valuation ratios, and price action. Its unique value proposition lies in its unparalleled ease of use combined with deep, reliable data, offering a professional analysis toolkit at a fraction of the cost of institutional terminals. With a generous free tier and robust paid plans, it serves both individual retail investors and professional analysts who seek to make informed, data-driven investment decisions without the steep learning curve or exorbitant price tag.
About GrowPanel
GrowPanel is a sophisticated, real-time subscription analytics platform engineered specifically for SaaS companies navigating the complexities of recurring revenue. It eliminates the chaos of manual spreadsheets and fragmented data by providing a single source of truth for all critical financial metrics. By connecting directly to billing platforms like Stripe, Chargebee, or Recurly, GrowPanel instantly surfaces actionable insights into MRR, ARR, churn, retention, and expansion revenue. Designed for founders, finance leaders, and growth teams, its core value proposition is delivering unparalleled clarity and speed, enabling data-driven decisions that directly impact the bottom line. Beyond mere dashboards, it offers deep-dive capabilities like cohort analysis, cashflow reporting, and AI-powered querying, all wrapped in a mobile-first interface. Founded by an entrepreneur who has scaled a SaaS business to $10M ARR, GrowPanel is built with the practical needs of high-growth companies in mind, offering a generous free tier until $200k ARR and a commitment to data security with EU-hosted, GDPR-compliant infrastructure.
Frequently Asked Questions
Dividend Data FAQ
How does the free tier work and what are credits?
The free tier provides 2,500 credits per month that never expire, with no credit card required to start. Each data request made via a spreadsheet function consumes a small number of credits (typically 1-2 per call). This generous allowance allows users to perform substantial analysis and automation for free. It's designed to let investors fully test the platform's capabilities in their real-world workflows without a time-limited trial.
What kind of data can I access with the spreadsheet functions?
You can access a vast array of data points spanning dividends, quotes, fundamentals, and ratios. Specific examples include forward and historical dividend amounts/yields, ex-dividend and payment dates, current stock price, 30+ years of price history, complete financial statement items (revenue, EPS, cash flow), and over 100 pre-calculated financial ratios like P/E, P/B, and ROIC. The documentation provides a full list of all available metrics for each function.
Do I need to know how to code or set up an API?
Absolutely not. Dividend Data is built specifically to require zero coding or technical setup. There are no API keys to manage. After installing the add-in from the Google Workspace or Microsoft AppSource store, you simply use the provided custom formulas directly in your spreadsheet cells as you would any native function like =SUM(). The complexity of data sourcing and management is handled entirely in the background.
Is my data and portfolio information secure?
Yes. Dividend Data takes security seriously. The connection between your spreadsheet and their servers is secure. When using the portfolio tracking features in the Pro Terminal, your holdings data is stored privately. The company has a clear privacy policy and terms of use. Furthermore, as an official add-in listed on Google and Microsoft's marketplaces, it adheres to these platforms' security and compliance standards.
GrowPanel FAQ
What billing platforms does GrowPanel integrate with?
GrowPanel offers seamless one-click integration with leading subscription billing platforms including Stripe, Chargebee, and Recurly. The platform is designed to connect with virtually any billing source that can provide the necessary transaction data, ensuring flexibility for businesses using custom or less common payment processors.
How does the "free until $200k ARR" pricing work?
GrowPanel offers its full analytics platform completely free of charge for companies with less than $200,000 in Annual Recurring Revenue (ARR). This allows early-stage and growing SaaS businesses to access enterprise-grade analytics without upfront cost. Once your company's ARR exceeds $200k, you will transition to a paid subscription plan, the details of which are provided before the transition occurs.
Is my data secure and compliant with privacy regulations?
Yes. GrowPanel prioritizes data security and privacy. The platform's infrastructure is hosted within the European Union, ensuring strong data protection standards. It is fully compliant with the General Data Protection Regulation (GDPR), giving businesses and their customers confidence that their sensitive financial and customer data is handled with the utmost care and in accordance with strict regulatory requirements.
Can I use GrowPanel on my mobile phone?
Absolutely. GrowPanel is built with a mobile-first design philosophy, ensuring all dashboards, reports, and features work flawlessly on smartphones and tablets. You can access every metric, switch between connected accounts, apply filters, and even use the AI chat functionality with the same depth and responsiveness as on a desktop, providing true on-the-go access to your business analytics.
Alternatives
Dividend Data Alternatives
Dividend Data is a specialized financial data tool that provides extensive dividend and fundamental stock information directly within spreadsheet applications like Google Sheets and Excel. It falls into the category of self-service investment research platforms, designed to empower individual investors with deep, historical data sets. Users often explore alternatives for various reasons. Some may have specific budget constraints or require a different pricing model, while others might need features tailored to different investment strategies, such as technical analysis or real-time alerts. Platform compatibility is another key factor, as some investors prefer web-based dashboards, mobile apps, or integration with other software beyond spreadsheets. When evaluating other options, consider the depth and historical range of the data offered, the ease of access and integration into your existing workflow, and the overall cost relative to the value provided. The ideal solution should align with your primary investment methodology, whether it's dividend growth, value investing, or broader market analysis, without unnecessary complexity or expense.
GrowPanel Alternatives
GrowPanel is a specialized analytics platform designed for SaaS businesses, focusing on real-time subscription metrics like MRR, churn, and LTV. It belongs to the category of SaaS analytics and revenue intelligence tools, aiming to replace manual spreadsheet tracking with automated, connected dashboards. Users often explore alternatives for various reasons. As a company scales beyond a certain revenue threshold, its pricing model may no longer fit. Some teams require deeper integrations with their specific tech stack, more advanced forecasting, or a different user interface philosophy. Others might seek a tool that bundles analytics with broader business intelligence or financial planning capabilities. When evaluating other options, key considerations include the depth of integration with your billing provider, the real-time accuracy of data, the flexibility of reporting and segmentation, and the overall total cost of ownership. Security, data residency, and the ability to handle complex subscription models are also critical factors for a growing SaaS business.