Fusedash vs StatPecker
Side-by-side comparison to help you choose the right AI tool.
Fusedash transforms raw data into intuitive dashboards and charts, enabling quick insights and informed team actions.
Last updated: March 4, 2026

StatPecker
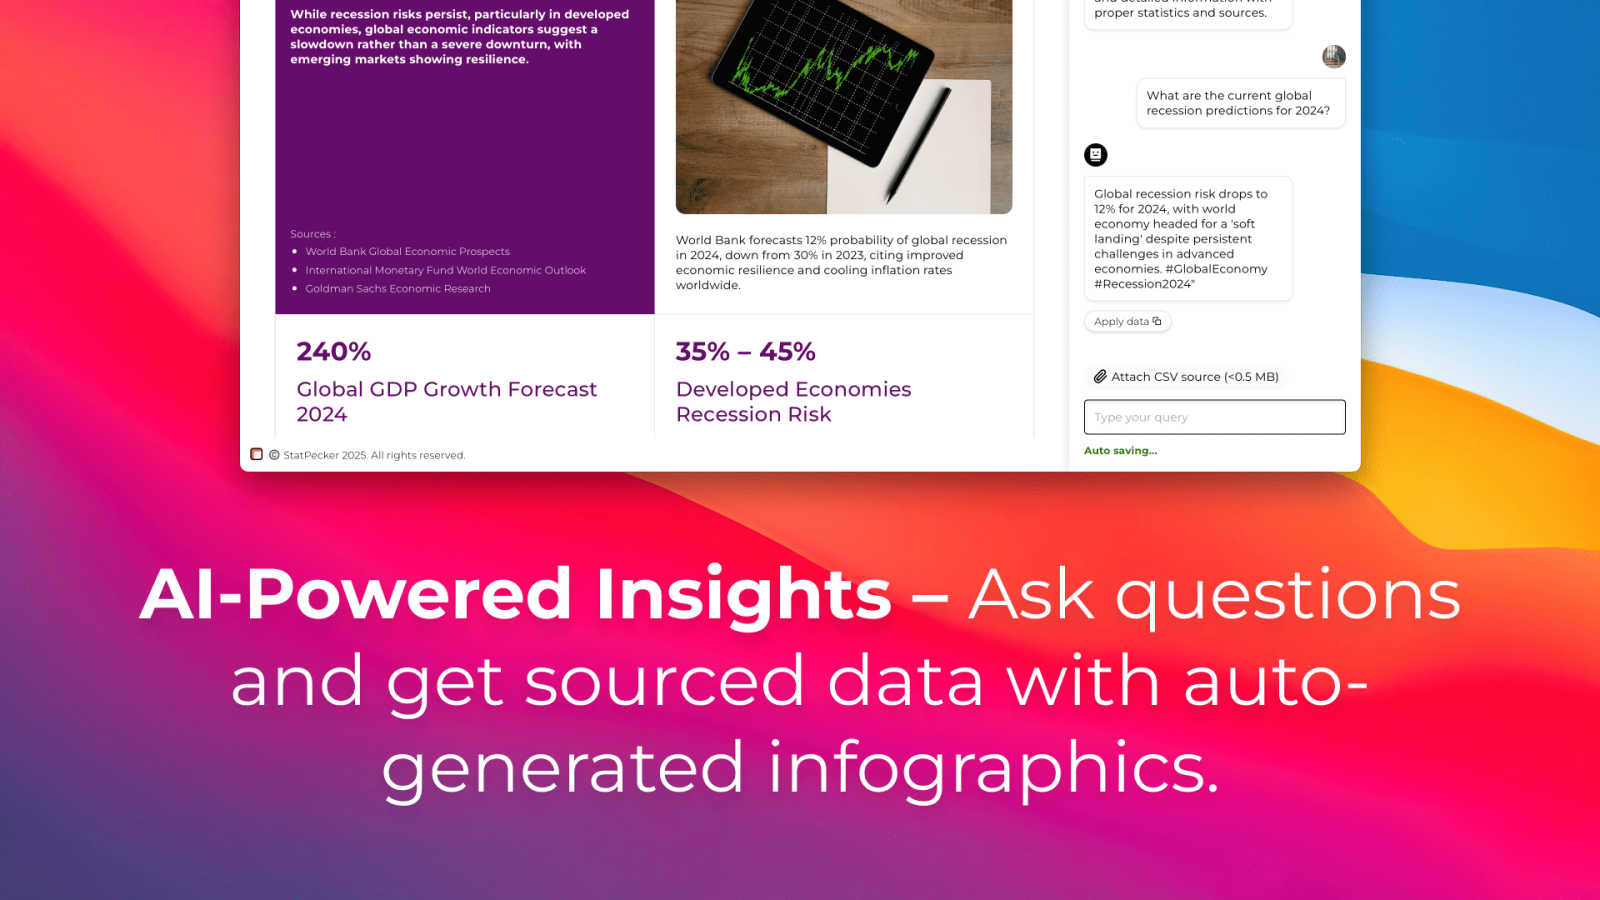
StatPecker turns your private data into instant, shareable insights and visuals.
Last updated: March 1, 2026
Visual Comparison
Fusedash

StatPecker
Feature Comparison
Fusedash
Flexible Views
Fusedash offers the ability to build the right dashboard view tailored to different audiences. By allowing users to transform the same dataset into dashboards, charts, maps, or report-style views, stakeholders can easily access the information that matters most to them without unnecessary back-and-forth discussions.
AI Chart Generator
The AI Chart Generator enables users to create clear and informative visuals from CSVs or APIs in a matter of minutes. This feature simplifies the chart creation process by allowing users to select the appropriate chart type, apply comparisons, and refine labels, ensuring that each chart effectively communicates its intended story.
Dashboard Software
Fusedash combines dashboards with narrative reporting within one seamless workspace. This feature allows users to not only monitor KPIs but also provide context about performance changes through storytelling, keeping teams aligned and minimizing the chances of conflicting reports.
AI Chat
The AI Chat feature enhances the user experience by allowing team members to ask questions about their data in plain language. This innovative tool provides suggestions for metrics, charts, and breakdowns, facilitating a quicker understanding of the data and helping users turn insights into shareable dashboard views.
StatPecker
AI-Powered Query & Insights
Simply ask a question in plain English, and StatPecker's AI scours validated sources to deliver instant, credible answers. This feature removes the barrier of complex analytical tools, allowing anyone to extract key trends, global comparisons, and data-driven insights without technical know-how. The results are not just text, but the foundation for the accompanying visualizations.
Local SQL Agent for Private CSV Analysis
A standout feature for data-sensitive workflows, the Local SQL Agent allows users to upload CSV files (up to 50MB) for completely private analysis. The entire process—from data preparation and query generation to analysis—runs securely on the user's own device. This ensures sensitive business or personal data never leaves your computer while still enabling powerful, exploratory questioning and insight generation.
Instant, Publish-Ready Visualizations
Every insight generated, whether from a public query or a private CSV, is automatically converted into clean, professional charts and infographics. These visuals are designed to be embedded directly into blogs, websites, reports, or shared on social media. The platform handles the entire design process, delivering assets that are both aesthetically stunning and effectively communicative.
Flexible Export and Embedding
StatPecker provides maximum utility for the created content. Users can download infographics as standard image files for use in presentations, reports, or print materials. Alternatively, visuals can be embedded as interactive elements into any digital property, enhancing reader engagement and providing a seamless, integrated data storytelling experience across platforms.
Use Cases
Fusedash
Marketing Performance Tracking
Marketing teams can leverage Fusedash to create interactive dashboards that monitor campaign performance in real-time. By visualizing key metrics such as conversion rates and ROI, marketers can quickly adapt strategies based on data-driven insights.
Sales Analysis
Sales teams can utilize Fusedash to analyze sales data across different regions or time periods. By drilling down into specific segments and visualizing trends, sales professionals can identify opportunities for growth and adjust their tactics accordingly.
Operational Efficiency Monitoring
Operations teams can harness Fusedash to track key operational metrics, such as production efficiency and supply chain performance. By consolidating data from various sources into clear dashboards, they can quickly identify inefficiencies and implement improvements.
Financial Reporting
Finance departments can use Fusedash to create comprehensive financial reports that combine historical data with real-time insights. By standardizing KPIs and metrics across the organization, finance teams can ensure consistency in reporting and facilitate better decision-making at all levels.
StatPecker
Content Creation & Blogging
Bloggers, journalists, and digital marketers use StatPecker to rapidly find and visualize supporting data for their articles. Instead of using generic or outdated charts, they can generate unique, up-to-date infographics that bolster their arguments, increase reader trust, and significantly improve the visual appeal and shareability of their content.
Business Reporting & Internal Communications
Analysts and team leaders leverage the CSV upload and Local SQL Agent to analyze sales, performance, or operational data privately. They can quickly identify which regions drove the most revenue, track KPIs, and create clear visual reports for stakeholder presentations or team meetings, streamlining the weekly or monthly reporting cycle.
Educational Material Development
Educators and trainers utilize the tool to convert complex statistical information or historical data into digestible visual aids. This makes lessons more engaging for students, helping to illustrate trends, comparisons, and concepts through visuals that are easier to understand and remember than rows of raw numbers.
Startup & Entrepreneurial Analysis
Founders and entrepreneurs use StatPecker to conduct quick market research, visualize competitive landscapes, or analyze early-stage metrics from their own operations. The free tier and easy query system allow for agile, data-informed decision-making without the overhead of dedicated business intelligence software or design resources.
Overview
About Fusedash
Fusedash is an innovative AI-powered data visualization platform designed to streamline the way teams interact with their data. By transforming connected data into clear and actionable insights, Fusedash serves as a unified workspace that allows users to create decision-ready dashboards, interactive charts, detailed maps, and narrative reports without the hassle of using multiple disconnected tools. This platform is ideal for organizations looking to enhance consistency and efficiency in their reporting processes. With Fusedash, users can define their key metrics and KPIs once and reuse these definitions across various views and reports, ensuring that everyone, from leadership to operational teams, is aligned and referencing the same trusted numbers. It caters to teams that are weary of manual reporting cycles and discrepancies in data storytelling, empowering them to monitor real-time events and delve into the reasons behind the data trends by segmenting information by region or time. Integrated AI features, such as natural language data chat and smart visualization assistance, make data exploration faster and more accessible, turning raw data into a shared source of truth that drives alignment and action across the organization.
About StatPecker
StatPecker is an AI-powered data visualization and storytelling platform engineered to bridge the gap between complex data and compelling communication. It fundamentally reimagines the reporting process by automating the transformation of raw data, whether from online sources or private CSV files, into publication-ready infographics and charts in seconds. The tool serves a diverse audience, from content creators and marketers seeking to enrich their articles with credible visuals, to business analysts and educators who need to distill trends and present insights clearly without design expertise. Its core value proposition is twofold: unparalleled speed and accessibility in data visualization, and a staunch commitment to user privacy through its unique Local SQL Agent. By eliminating the need for manual design work or expensive services, StatPecker empowers users to maximize the impact of their data narratives, saving significant time and cost while enhancing the clarity and engagement of their message.
Frequently Asked Questions
Fusedash FAQ
What types of data sources can I connect to Fusedash?
Fusedash allows users to connect various data sources, including CSV files, APIs, and databases. This flexibility ensures that you can integrate all relevant data into one platform for comprehensive analysis.
How does Fusedash ensure data consistency across reports?
Fusedash enables users to define key metrics and KPIs once, which can then be reused across all dashboards and reports. This standardization helps maintain consistent data representation, reducing the risk of conflicting information.
Can I customize the visualizations in Fusedash?
Absolutely! Fusedash offers a range of customization options, allowing users to tailor dashboards, charts, and reports based on their specific needs. You can adjust layouts, filters, and time ranges to create the most relevant views for your audience.
Is there support for real-time data monitoring in Fusedash?
Yes, Fusedash provides real-time monitoring capabilities, allowing teams to stay updated with the latest data. This feature ensures that users can react swiftly to changes and make informed decisions based on live insights.
StatPecker FAQ
How does the Local SQL Agent ensure my data is private?
The Local SQL Agent is engineered for privacy-by-default. When you upload a CSV file, the data is processed entirely on your device. The AI that generates SQL queries and the engine that runs them operate locally, meaning your raw data never transmits to StatPecker's servers. Only you see the input and the resulting visual outputs.
What are the limits of the Free Tier?
The Free Tier is designed for casual or introductory use. It includes unlimited projects and embeds, but limits users to 25 AI queries (questions to the public insight engine) and 10 CSV uploads for local analysis. This allows users to thoroughly test the platform's core capabilities before considering an upgrade.
What does "Lifetime Access" in the paid plan include?
The one-time payment "Lifetime Access" plan grants permanent access to all current and future features of StatPecker. This includes unlimited AI queries, unlimited CSV uploads, unlimited projects and embeds, and priority consideration for feature requests. It's a cost-effective option for power users, professionals, and organizations planning for long-term use.
Can I edit the infographics after they are generated?
Yes, while the AI generates complete, ready-to-use visuals, StatPecker provides options for manual edits on the embeds. This allows you to adjust colors, and text, or tweak design elements to better align with your brand guidelines or specific presentation needs before publishing or sharing the final graphic.
Alternatives
Fusedash Alternatives
Fusedash is an innovative AI-powered data visualization platform that helps teams turn raw data into actionable insights through clear dashboards and charts. Positioned within the Analytics & Data and Business Intelligence categories, it serves as a unified workspace, allowing users to create decision-ready visualizations without the hassle of managing multiple disconnected tools. Users often seek alternatives to Fusedash for various reasons, including pricing considerations, feature requirements, or specific platform needs. When evaluating an alternative, it's important to consider factors such as ease of use, integration capabilities, scalability, and the level of data customization offered. An ideal alternative should align with your team's workflow and enhance your ability to make data-driven decisions.
StatPecker Alternatives
StatPecker is an AI-powered data visualization tool that transforms complex datasets into clear, engaging infographics. It belongs to the category of automated data storytelling and insight generation platforms, designed to make data analysis accessible and visually compelling for a wide audience. Users often explore alternatives to StatPecker for various reasons. Common drivers include budget constraints, the need for more advanced or specific analytical features, integration requirements with other business software, or a preference for a different user interface and workflow. Every team has unique priorities, from deep statistical modeling to real-time collaborative dashboards. When evaluating an alternative, consider your core needs. Key factors often include the tool's data source compatibility, the depth of analysis versus ease of use, customization options for branding, sharing and embedding capabilities, and of course, the overall cost structure. The right choice balances powerful functionality with an intuitive process that fits your team's skill level and goals.