Dividend Data vs Portfolio Genius
Side-by-side comparison to help you choose the right AI tool.
Dividend Data
Dividend Data instantly delivers stock dividends, prices, and financials directly into your Google Sheets or Excel spreadsheets.
Last updated: March 11, 2026
Portfolio Genius
Portfolio Genius is your AI advisor that analyzes markets and manages investments for you.
Last updated: March 1, 2026
Visual Comparison
Dividend Data

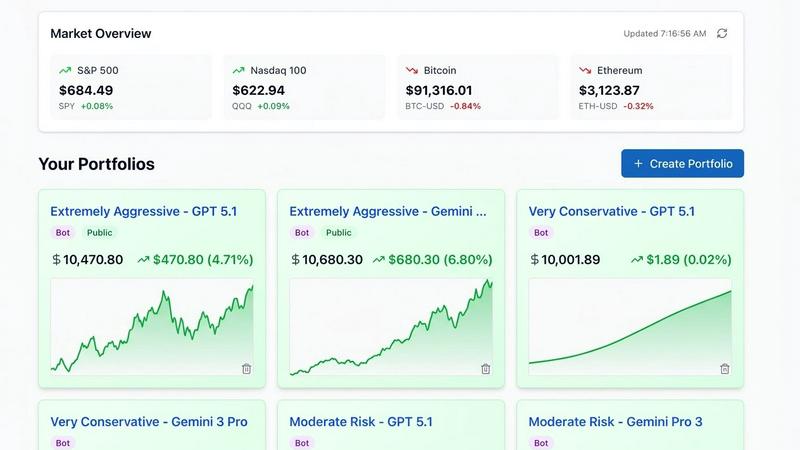
Portfolio Genius
Feature Comparison
Dividend Data
Extensive Custom Spreadsheet Functions
Dividend Data provides a specialized library of 16+ custom functions, such as DIVIDENDDATA_DIVIDENDS and DIVIDENDDATA_RATIOS, that act as direct conduits to live financial data. Users simply type these formulas into any cell, referencing a stock ticker and desired metric, and the platform instantly populates the cell with accurate, updated information. This transforms static spreadsheets into dynamic, auto-updating financial dashboards, covering everything from forward dividend yields and ex-dates to P/E ratios and diluted EPS.
Deep Historical & Fundamental Data Library
The platform grants users access to a vast repository of over 30 years of historical market data. This is not limited to price history but extends deeply into fundamental analysis, including decades of dividend payments, annual and quarterly financial statements, and hundreds of key financial ratios. This long-term perspective is crucial for conducting thorough trend analysis, assessing a company's financial resilience through cycles, and building robust valuation models based on historical performance.
Multi-Platform Spreadsheet Integration
A key operational feature is its seamless compatibility with both Google Sheets and Microsoft Excel. Users are not locked into a single ecosystem; they can leverage Dividend Data's capabilities within their preferred spreadsheet environment. The add-ins are officially available on the Google Workspace Marketplace and Microsoft AppSource, ensuring easy installation, secure operation, and smooth performance whether working in the cloud with Sheets or locally with Excel.
AI-Powered Research & Portfolio Tools
Beyond spreadsheets, Dividend Data offers a web-based Terminal featuring advanced tools like an AI Analyst. This assistant can answer complex investment questions, generate research reports, and provide insights based on the platform's extensive dataset. Coupled with automated portfolio tracking that aggregates holdings, calculates projected income, and visualizes performance, it creates a holistic research and management suite for the modern investor.
Portfolio Genius
Multi-Model AI Analysis
Portfolio Genius distinguishes itself by offering a choice of AI analytical engines, including models like GPT, Claude, and Gemini. Users can select an AI that aligns with their investment philosophy, whether it's aggressive growth, conservative value investing, or balanced risk management. This feature provides diverse perspectives on the same portfolio, enabling more nuanced and personalized insights than a single-algorithm system could ever deliver.
Real-Time Portfolio Analytics & Leaderboards
The platform provides live market data and comprehensive performance metrics updated in real-time across all holdings. A unique social component is the Portfolio Leaderboards, where users can watch AI-managed portfolios with different strategies (Aggressive, Moderate, Conservative) compete. This allows for comparative analysis of performance and strategy in a dynamic, transparent environment, offering both education and competitive benchmarking.
Smart Trade Management & Suggestions
Beyond tracking, the tool offers intelligent trade management. Users can effortlessly log and track their trades to gain detailed insights into their trading patterns and win rates. The AI generates data-driven trade suggestions based on your portfolio's composition, risk profile, and prevailing market conditions, helping to identify potential opportunities or risks that may not be immediately apparent.
Unified Global Market Dashboard with Bank-Grade Security
Portfolio Genius consolidates tracking for stocks, ETFs, and cryptocurrencies from major global exchanges into a single, intuitive dashboard. This provides a holistic view of a diversified portfolio. All of this is protected by enterprise-level, bank-grade security standards, ensuring that your sensitive financial data is encrypted and safeguarded, giving users peace of mind alongside powerful analytics.
Use Cases
Dividend Data
Building a Dividend Growth Screening Model
Investors focused on dividend growth can use Dividend Data to create a powerful screening spreadsheet. By using functions to pull dividend growth rates, payout ratios, and earnings history for thousands of stocks, they can instantly filter for companies with a history of consistent, sustainable dividend increases. This automates the initial discovery phase, allowing for rapid identification of candidates that meet specific criteria for further due diligence.
Automating Monthly Portfolio Income Reports
For income-focused investors, manually tracking dividend payments across a portfolio is tedious. With Dividend Data, users can build a master portfolio sheet where each holding's ticker automatically pulls the next ex-dividend date, payment date, and declared dividend amount. This sheet can then forecast monthly and annual income, update live, and provide a clear, always-current view of cash flow expectations without any manual data entry.
Conducting Comparative Fundamental Analysis
Analysts and serious investors can perform deep-dive comparisons between companies. By using functions to pull side-by-side data on metrics like ROE, debt-to-equity, profit margins, and valuation multiples, they can build comprehensive comparison tables. The 30+ years of data allow for analyzing how these metrics have evolved over time, providing context that is essential for determining relative strength and long-term operational efficiency.
Creating Dynamic Financial Dashboards
Financial educators, bloggers, or investment club leaders can use Dividend Data to create interactive dashboards. They can build sheets that display key real-time stats for a watchlist, such as current price, dividend yield, and P/E ratio, which refresh automatically. This turns a simple spreadsheet into a live monitoring tool, perfect for presentations, educational content, or keeping a group informed with up-to-the-minute data.
Portfolio Genius
The Hands-Off Beginner Investor
A new investor feeling overwhelmed by market complexity can use Portfolio Genius as an educational guide. By inputting their interests and a hypothetical amount, they can explore AI-generated portfolio compositions and receive plain-English explanations of asset allocation, risk, and performance drivers, building confidence before investing real capital.
The Time-Constrained Professional
A busy professional with an existing portfolio lacks the hours to conduct daily research. Portfolio Genius acts as their automated financial analyst, providing daily or weekly reviews, flagging significant news affecting their holdings, and offering concise trade suggestions, ensuring their investments are monitored continuously without demanding their constant attention.
The Strategy-Validating Active Trader
An experienced trader uses the platform not for basic advice, but as a sophisticated sounding board. They leverage the multi-model AI to run their strategies against different analytical frameworks, use the leaderboards to compare against other approaches, and utilize the detailed trade analytics to critically review their own performance and refine their methodology.
The Portfolio Diversification Manager
An investor concerned about over-concentration in a particular sector or asset class uses the platform's visual diversification tools. The AI analyzes the current allocation, identifies imbalances, and suggests alternative assets or funds to achieve a healthier, more resilient portfolio spread across global markets and asset types.
Overview
About Dividend Data
Dividend Data is a powerful financial data platform designed to democratize access to institutional-grade stock market information. At its core, it is a spreadsheet add-in that seamlessly integrates over 30 years of historical and real-time data for more than 80,000 tickers directly into Google Sheets and Microsoft Excel. The product eliminates the traditional barriers of complex APIs, coding requirements, and manual copy-pasting, delivering data through simple, custom formulas. Built specifically by and for dividend and fundamental investors, it provides instant access to a comprehensive suite of metrics including dividend histories, yields, payout ratios, growth rates, complete financial statements, earnings reports, valuation ratios, and price action. Its unique value proposition lies in its unparalleled ease of use combined with deep, reliable data, offering a professional analysis toolkit at a fraction of the cost of institutional terminals. With a generous free tier and robust paid plans, it serves both individual retail investors and professional analysts who seek to make informed, data-driven investment decisions without the steep learning curve or exorbitant price tag.
About Portfolio Genius
Portfolio Genius is a transformative AI-powered platform that redefines personal investing by acting as a sophisticated co-pilot for your financial journey. It transcends the basic functionality of a simple portfolio tracker, positioning itself as an intelligent advisor that synthesizes vast amounts of real-time market data, news sentiment, and your unique portfolio composition to deliver actionable, data-driven insights. The core mission is to democratize advanced portfolio management, making institutional-grade analytical tools accessible to individual investors who may lack the time, resources, or expertise of professional fund managers.
Its standout value proposition lies in its innovative multi-model AI flexibility. Unlike rigid systems, Portfolio Genius allows users to leverage the distinct analytical "personalities" of leading AI models like GPT, Claude, or Gemini. This means an investor can tailor the analysis to match their specific philosophy—opting for a growth-oriented model for aggressive strategies, a value-focused model for long-term holdings, or a risk-averse model for capital preservation. By blending automated, 24/7 monitoring with a natural language conversational interface, the platform transforms complex financial analysis into an intuitive, interactive dialogue. It is designed for a broad spectrum of users: from beginners seeking educational guidance and validation, to busy professionals needing automated oversight, and even experienced traders looking for a robust, data-driven second opinion to pressure-test their own strategies.
Frequently Asked Questions
Dividend Data FAQ
How does the free tier work and what are credits?
The free tier provides 2,500 credits per month that never expire, with no credit card required to start. Each data request made via a spreadsheet function consumes a small number of credits (typically 1-2 per call). This generous allowance allows users to perform substantial analysis and automation for free. It's designed to let investors fully test the platform's capabilities in their real-world workflows without a time-limited trial.
What kind of data can I access with the spreadsheet functions?
You can access a vast array of data points spanning dividends, quotes, fundamentals, and ratios. Specific examples include forward and historical dividend amounts/yields, ex-dividend and payment dates, current stock price, 30+ years of price history, complete financial statement items (revenue, EPS, cash flow), and over 100 pre-calculated financial ratios like P/E, P/B, and ROIC. The documentation provides a full list of all available metrics for each function.
Do I need to know how to code or set up an API?
Absolutely not. Dividend Data is built specifically to require zero coding or technical setup. There are no API keys to manage. After installing the add-in from the Google Workspace or Microsoft AppSource store, you simply use the provided custom formulas directly in your spreadsheet cells as you would any native function like =SUM(). The complexity of data sourcing and management is handled entirely in the background.
Is my data and portfolio information secure?
Yes. Dividend Data takes security seriously. The connection between your spreadsheet and their servers is secure. When using the portfolio tracking features in the Pro Terminal, your holdings data is stored privately. The company has a clear privacy policy and terms of use. Furthermore, as an official add-in listed on Google and Microsoft's marketplaces, it adheres to these platforms' security and compliance standards.
Portfolio Genius FAQ
Does Portfolio Genius provide investment advice?
No. Portfolio Genius is strictly a portfolio tracking, analytics, and educational platform. It provides informational analysis, data-driven insights, and market context based on your holdings and preferences. All suggestions are for informational purposes only and should not be construed as personalized financial or investment advice. Users must make their own investment decisions.
How does the AI generate portfolio insights and trade suggestions?
The AI system integrates and processes multiple real-time data sources: pricing services for live market data, databases for company financials and fundamentals, news feeds processed for market sentiment, and web search for the latest research and analyst reports. It synthesizes this information against your specific portfolio composition and stated risk profile to generate its analyses and suggestions.
Can I try Portfolio Genius without committing financially?
Yes. You can explore core functionality without even creating an account by using the "Create a Portfolio Without Signing Up" demo. This allows you to describe investment goals and see AI analysis on a hypothetical portfolio. All paid plans also include a full 7-day free trial, allowing you to test all premium features with your actual portfolio before any payment is required.
What is the benefit of the Portfolio Leaderboards?
The Leaderboards offer a unique, transparent view into real-world application of different AI-driven investment strategies (Aggressive, Moderate, Conservative). They serve as an educational tool to observe how various risk profiles perform over time, a source of ideas for portfolio construction, and a community benchmark against which users can compare their own portfolio's strategy and performance.
Alternatives
Dividend Data Alternatives
Dividend Data is a specialized financial data tool that provides extensive dividend and fundamental stock information directly within spreadsheet applications like Google Sheets and Excel. It falls into the category of self-service investment research platforms, designed to empower individual investors with deep, historical data sets. Users often explore alternatives for various reasons. Some may have specific budget constraints or require a different pricing model, while others might need features tailored to different investment strategies, such as technical analysis or real-time alerts. Platform compatibility is another key factor, as some investors prefer web-based dashboards, mobile apps, or integration with other software beyond spreadsheets. When evaluating other options, consider the depth and historical range of the data offered, the ease of access and integration into your existing workflow, and the overall cost relative to the value provided. The ideal solution should align with your primary investment methodology, whether it's dividend growth, value investing, or broader market analysis, without unnecessary complexity or expense.
Portfolio Genius Alternatives
Portfolio Genius is an AI-powered investment advisor in the business and finance category, designed to analyze markets and manage trades. It acts as an intelligent co-pilot, using sophisticated models to provide personalized portfolio insights and actionable recommendations. Users often explore alternatives for various reasons. Some may seek different pricing models or subscription tiers that better fit their budget. Others might prioritize specific features, like deeper integration with certain brokerages, more advanced manual trading tools, or a platform available on their preferred operating system. The need for a different user experience or investment philosophy alignment also drives this search. When evaluating alternatives, consider your primary goals. Look for a tool's core analytical capability, the transparency of its recommendations, and how well it aligns with your risk tolerance and strategy. Security and data privacy are paramount, as is the overall value proposition relative to cost. The ideal platform should feel like a natural extension of your financial mindset.