Banknaked vs Dividend Data
Side-by-side comparison to help you choose the right AI tool.

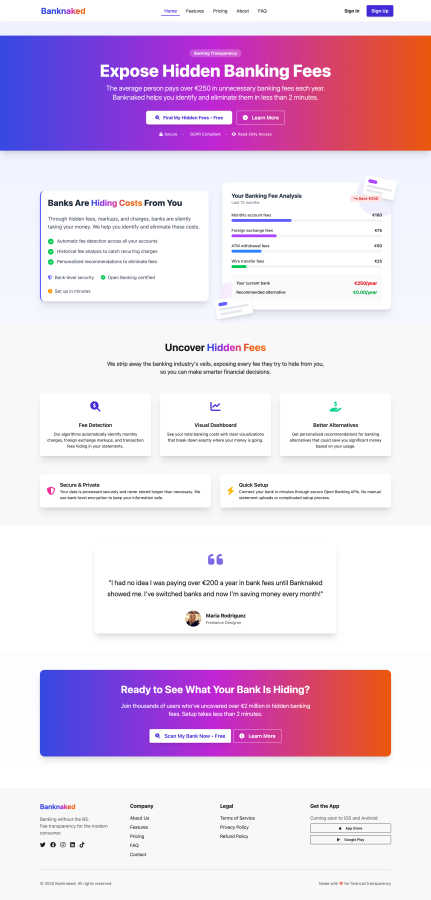
Banknaked
Banknaked reveals hidden banking fees, helping you save money and make informed financial choices in under two minutes.
Last updated: March 1, 2026
Dividend Data
Dividend Data instantly delivers stock dividends, prices, and financials directly into your Google Sheets or Excel spreadsheets.
Last updated: March 11, 2026
Visual Comparison
Banknaked
Dividend Data

Feature Comparison
Banknaked
Automatic Fee Detection
Banknaked employs advanced algorithms to automatically identify hidden fees across all your bank accounts. By scanning through your transactions, it reveals monthly charges, foreign exchange markups, and transaction fees that are often overlooked in traditional statements.
Visual Dashboard
The platform features a user-friendly visual dashboard that presents your total banking costs in an easily digestible format. Clear visualizations help you understand where your money is going, making it simpler to track and manage your expenses.
Personalized Recommendations
Banknaked goes beyond analysis by providing tailored recommendations for better banking alternatives. Based on your individual usage patterns, it suggests accounts that could save you significant amounts of money, allowing you to make more informed financial decisions.
Secure & Private
With a strong commitment to user privacy, Banknaked processes your data securely using bank-level encryption. It operates on a read-only access model, ensuring that your information is never stored longer than necessary and safeguarding your financial data against unauthorized access.
Dividend Data
Extensive Custom Spreadsheet Functions
Dividend Data provides a specialized library of 16+ custom functions, such as DIVIDENDDATA_DIVIDENDS and DIVIDENDDATA_RATIOS, that act as direct conduits to live financial data. Users simply type these formulas into any cell, referencing a stock ticker and desired metric, and the platform instantly populates the cell with accurate, updated information. This transforms static spreadsheets into dynamic, auto-updating financial dashboards, covering everything from forward dividend yields and ex-dates to P/E ratios and diluted EPS.
Deep Historical & Fundamental Data Library
The platform grants users access to a vast repository of over 30 years of historical market data. This is not limited to price history but extends deeply into fundamental analysis, including decades of dividend payments, annual and quarterly financial statements, and hundreds of key financial ratios. This long-term perspective is crucial for conducting thorough trend analysis, assessing a company's financial resilience through cycles, and building robust valuation models based on historical performance.
Multi-Platform Spreadsheet Integration
A key operational feature is its seamless compatibility with both Google Sheets and Microsoft Excel. Users are not locked into a single ecosystem; they can leverage Dividend Data's capabilities within their preferred spreadsheet environment. The add-ins are officially available on the Google Workspace Marketplace and Microsoft AppSource, ensuring easy installation, secure operation, and smooth performance whether working in the cloud with Sheets or locally with Excel.
AI-Powered Research & Portfolio Tools
Beyond spreadsheets, Dividend Data offers a web-based Terminal featuring advanced tools like an AI Analyst. This assistant can answer complex investment questions, generate research reports, and provide insights based on the platform's extensive dataset. Coupled with automated portfolio tracking that aggregates holdings, calculates projected income, and visualizes performance, it creates a holistic research and management suite for the modern investor.
Use Cases
Banknaked
Identify Unnecessary Fees
Users can utilize Banknaked to uncover hidden banking fees that accumulate over time, potentially saving hundreds of euros annually. By quickly analyzing their accounts, individuals can identify and eliminate unnecessary charges.
Optimize Banking Choices
With personalized recommendations for alternative banking options, users can leverage Banknaked to switch to accounts that are more cost-effective. This feature empowers consumers to make savvy choices that better align with their financial habits.
Negotiate with Current Banks
Armed with detailed insights into their banking fees, users can approach their current banks with confidence. Banknaked provides the necessary data to negotiate lower fees or better terms, enhancing the user's ability to advocate for their financial interests.
Enhance Financial Awareness
Banknaked helps users gain a deeper understanding of their banking costs, promoting overall financial literacy. By visualizing spending patterns and identifying hidden costs, consumers can make informed decisions about their finances and budget more effectively.
Dividend Data
Building a Dividend Growth Screening Model
Investors focused on dividend growth can use Dividend Data to create a powerful screening spreadsheet. By using functions to pull dividend growth rates, payout ratios, and earnings history for thousands of stocks, they can instantly filter for companies with a history of consistent, sustainable dividend increases. This automates the initial discovery phase, allowing for rapid identification of candidates that meet specific criteria for further due diligence.
Automating Monthly Portfolio Income Reports
For income-focused investors, manually tracking dividend payments across a portfolio is tedious. With Dividend Data, users can build a master portfolio sheet where each holding's ticker automatically pulls the next ex-dividend date, payment date, and declared dividend amount. This sheet can then forecast monthly and annual income, update live, and provide a clear, always-current view of cash flow expectations without any manual data entry.
Conducting Comparative Fundamental Analysis
Analysts and serious investors can perform deep-dive comparisons between companies. By using functions to pull side-by-side data on metrics like ROE, debt-to-equity, profit margins, and valuation multiples, they can build comprehensive comparison tables. The 30+ years of data allow for analyzing how these metrics have evolved over time, providing context that is essential for determining relative strength and long-term operational efficiency.
Creating Dynamic Financial Dashboards
Financial educators, bloggers, or investment club leaders can use Dividend Data to create interactive dashboards. They can build sheets that display key real-time stats for a watchlist, such as current price, dividend yield, and P/E ratio, which refresh automatically. This turns a simple spreadsheet into a live monitoring tool, perfect for presentations, educational content, or keeping a group informed with up-to-the-minute data.
Overview
About Banknaked
Banknaked is a groundbreaking financial clarity tool designed to provide transparency in banking fees, making it easier for consumers to understand the real costs associated with their banking activities. In an industry notorious for hidden charges, Banknaked acts as a beacon of clarity, connecting securely to users' bank accounts via Open Banking technology. It performs an extensive, automated audit of banking fees, offering a clean and intelligible breakdown that includes monthly maintenance fees, transaction costs, foreign exchange markups, ATM charges, and other ambiguous expenses. The platform prioritizes user privacy, employing read-only access to ensure that users can only view their information without any risk of unauthorized transactions. Within minutes, users can see past fees and receive annualized projections that highlight the cumulative effect of frequent small charges. Banknaked empowers users to take action by providing personalized recommendations for cheaper banking alternatives, making it an invaluable tool for anyone seeking financial sovereignty and digital privacy. Whether users are looking to negotiate with their current bank, switch to a better option, or simply gain a clearer understanding of their financial outflow, Banknaked is built for the modern consumer.
About Dividend Data
Dividend Data is a powerful financial data platform designed to democratize access to institutional-grade stock market information. At its core, it is a spreadsheet add-in that seamlessly integrates over 30 years of historical and real-time data for more than 80,000 tickers directly into Google Sheets and Microsoft Excel. The product eliminates the traditional barriers of complex APIs, coding requirements, and manual copy-pasting, delivering data through simple, custom formulas. Built specifically by and for dividend and fundamental investors, it provides instant access to a comprehensive suite of metrics including dividend histories, yields, payout ratios, growth rates, complete financial statements, earnings reports, valuation ratios, and price action. Its unique value proposition lies in its unparalleled ease of use combined with deep, reliable data, offering a professional analysis toolkit at a fraction of the cost of institutional terminals. With a generous free tier and robust paid plans, it serves both individual retail investors and professional analysts who seek to make informed, data-driven investment decisions without the steep learning curve or exorbitant price tag.
Frequently Asked Questions
Banknaked FAQ
How does Banknaked connect to my bank account?
Banknaked connects to your bank account via secure Open Banking APIs. This allows it to perform a comprehensive audit of your banking transactions while maintaining strict privacy and security standards.
Is my data safe with Banknaked?
Yes, your data is processed with bank-level encryption and is subject to GDPR compliance. Banknaked operates on a read-only access model, meaning it cannot move your money or perform transactions.
How long does it take to analyze my banking fees?
Setting up Banknaked takes less than two minutes, and within that time, you can receive a thorough analysis of your banking fees. The platform is designed to be quick and user-friendly.
What if I find hidden fees after using Banknaked?
If you discover hidden fees after using Banknaked, the platform provides personalized recommendations to help you switch to better banking options or negotiate with your current bank for lower fees.
Dividend Data FAQ
How does the free tier work and what are credits?
The free tier provides 2,500 credits per month that never expire, with no credit card required to start. Each data request made via a spreadsheet function consumes a small number of credits (typically 1-2 per call). This generous allowance allows users to perform substantial analysis and automation for free. It's designed to let investors fully test the platform's capabilities in their real-world workflows without a time-limited trial.
What kind of data can I access with the spreadsheet functions?
You can access a vast array of data points spanning dividends, quotes, fundamentals, and ratios. Specific examples include forward and historical dividend amounts/yields, ex-dividend and payment dates, current stock price, 30+ years of price history, complete financial statement items (revenue, EPS, cash flow), and over 100 pre-calculated financial ratios like P/E, P/B, and ROIC. The documentation provides a full list of all available metrics for each function.
Do I need to know how to code or set up an API?
Absolutely not. Dividend Data is built specifically to require zero coding or technical setup. There are no API keys to manage. After installing the add-in from the Google Workspace or Microsoft AppSource store, you simply use the provided custom formulas directly in your spreadsheet cells as you would any native function like =SUM(). The complexity of data sourcing and management is handled entirely in the background.
Is my data and portfolio information secure?
Yes. Dividend Data takes security seriously. The connection between your spreadsheet and their servers is secure. When using the portfolio tracking features in the Pro Terminal, your holdings data is stored privately. The company has a clear privacy policy and terms of use. Furthermore, as an official add-in listed on Google and Microsoft's marketplaces, it adheres to these platforms' security and compliance standards.
Alternatives
Banknaked Alternatives
Banknaked is an innovative financial clarity tool that falls under the category of personal finance management applications. It specializes in revealing hidden bank fees that can accumulate over time, allowing users to gain a clearer understanding of their banking costs. With a focus on transparency and user privacy, Banknaked connects securely to your bank accounts to provide an automated audit of charges, bringing to light often-overlooked expenses. Users often seek alternatives to Banknaked for various reasons, including pricing structures, feature sets, and specific platform needs. When choosing an alternative, it’s essential to consider factors such as the comprehensiveness of fee detection, the clarity of data presentation, and the relevance of personalized recommendations based on your financial behavior. Ensuring that the alternative aligns with your specific goals in managing banking costs can lead to better financial outcomes.
Dividend Data Alternatives
Dividend Data is a specialized financial data tool that provides extensive dividend and fundamental stock information directly within spreadsheet applications like Google Sheets and Excel. It falls into the category of self-service investment research platforms, designed to empower individual investors with deep, historical data sets. Users often explore alternatives for various reasons. Some may have specific budget constraints or require a different pricing model, while others might need features tailored to different investment strategies, such as technical analysis or real-time alerts. Platform compatibility is another key factor, as some investors prefer web-based dashboards, mobile apps, or integration with other software beyond spreadsheets. When evaluating other options, consider the depth and historical range of the data offered, the ease of access and integration into your existing workflow, and the overall cost relative to the value provided. The ideal solution should align with your primary investment methodology, whether it's dividend growth, value investing, or broader market analysis, without unnecessary complexity or expense.