ExcelDashboard AI

About ExcelDashboard AI
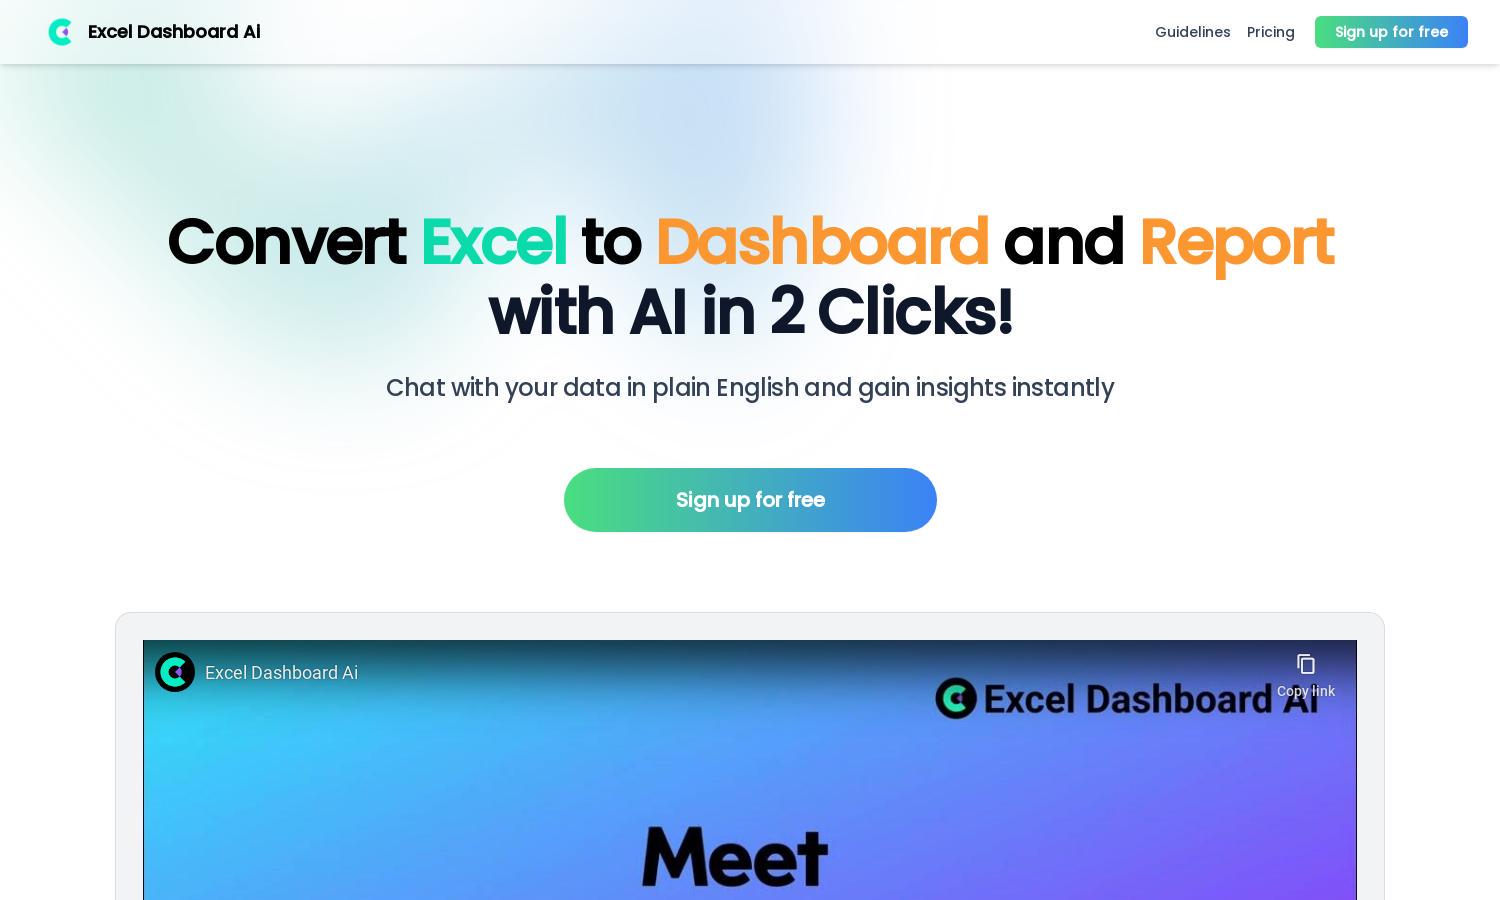
ExcelDashboard Ai is designed for users seeking to streamline data analysis. This innovative platform instantly transforms Excel spreadsheets into interactive dashboards, providing visual insights and comprehensive reports. With a user-friendly interface, ExcelDashboard Ai simplifies data visualization, empowering users to explore and analyze their data effectively.
ExcelDashboard Ai offers a free sign-up, along with premium options. Free users can transform data, while paid plans provide additional features like batch analysis and advanced insights. Upgrading enhances the experience, unlocking innovative tools for deeper data analysis and customization, making it a valuable investment for frequent users.
The user interface of ExcelDashboard Ai is sleek and intuitive, ensuring a seamless browsing experience. Users can easily navigate features for dashboard creation and report generation. The layout promotes efficient data interaction, while smart design elements make it straightforward for anyone to visualize and analyze data quickly.
How ExcelDashboard AI works
Users begin by signing up or logging into ExcelDashboard Ai. Once onboarded, they simply upload their Excel file and within moments, the platform processes the data. Users can then interact with their generated dashboards, edit visualizations using natural language commands, and easily download comprehensive analysis reports—making data interaction effortless.
Key Features for ExcelDashboard AI
Instant Dashboard Creation
ExcelDashboard Ai allows users to create custom data dashboards in real-time. This feature simplifies data visualization, enabling users to instantly generate interactive dashboards from their Excel files without prior coding experience, enhancing their analytical capabilities and insights effectively.
AI-Powered Insights
ExcelDashboard Ai harnesses the power of AI to provide users with insightful analysis quickly. This unique feature lets users ask questions in plain language and receive immediate interpretations of their data, uncovering valuable insights that inform decision-making and strategy formulation.
Comprehensive Report Generation
The platform enables effortless conversion of dashboards into detailed analysis reports. Users benefit from the ability to generate comprehensive, editable reports that are rich in visual data, facilitating easy customization and adjustments, perfect for presenting findings to stakeholders.
You may also like:


